


 हिन्दी
 中文
中文
 Русский
 العربية
")
Il Theremino_MCA pur essendo completamente Freeware e OpenSource è un vero Multi-Channel-Analyzer da laboratorio.
Ulteriori informazioni:
– Schemi elettrici e piani di montaggio: www.theremino.com/technical/schematics
– Software: www.theremino.com/downloads/radioactivity
– Hardware, autocostruzione e kits: www.theremino.com/contacts/producers
– Immagini e Video: www.theremino.com/video-and-images
– Articolo su Elettronica Open Source: tecniche-di-condizionamento-del-segnale-spettrometria-gamma
——————-
Hardware per la Spettrometria Gamma


Il Theremino_PmtAdapter contiene un circuito di retroazione in grado di mantiene la tensione stabile anche in presenza di forti variazioni della temperatura. In questo modo la taratura rimane precisa nel tempo e le righe degli isotopi non si spostano e non si allargano.
ATTENZIONE: Per ottenere le prestazioni ottimali è necessario usare tubi PMT cablati come indicato nel file PmtAdapters.pdf – I tubi PMT a bassa impedenza (con resistori da 1 mega o addirittura da 560k) non possono funzionare con questi adapters. Per utilizzarli occorrerebbe sostituire i loro resistori come da noi indicato.
Questo adattatore può essere usato con il ben noto software freeware PRA (ringraziamo Marek Dolleiser per aver aperto la strada a questo genere di analisi, il suo software PRA è un riferimento da molti anni e ci ha aiutato molto) ma solo con il Theremino_MCA si possono fare operazioni di filtraggio e di cancellazione del fondo utilissime per ottenere il massimo di informazioni in tempi ragionevoli.
Questo file comprende il progetto del PCB, le immagini e le simulazioni SPICE: PMT_Adapter_V3.1
Questa è la versione 3.2 con molti piccoli miglioramenti: PMT_Adapter_V3.2
Questa è la versione 3.3 con ulteriori miglioramenti: PMT_Adapter_V3.3
Most salient features:
– Compact only 50 X 70 mm
– No initial thermal drift due to the feedback loop.
– Adjustable voltage from 500 to 1500 V
– Very low power consumption only 10 mA @ 5 V
– Very low ripple only 100 uV
– Protected against short circuit
– Maximum power output 100 mW
– Preamp circuit and pulse enlargement (from 3/5 uS to 100 uS to be read by a PC sound card)
Caratteristiche tecniche:
– Compatto solo 50 X 70 mm
– Nessuna deriva termica iniziale grazie al circuito di retroazione.
– Regolabile in tensione da 500 a 1500 V
– Consumi molto bassi @5 v solo 10 mA
– Ripple bassissimo solo 100 uV
– Protetto contro il corto circuito
– Potenza max erogata 100 mW
– Circuito di preamplificazione e allargamento degli impulsi incorporato (porta gli impulsi da 3-5 uS a 100 uS per essere letti da una scheda audio del PC)
La costruzione semplice e ordinata riduce i difetti di costruzione e li rende immediatamente evidenti.


Nelle seguenti immagini si vede il PMT durante le prove.


Lo schema elettrico e un impulso di esempio che mostra il livello di rumore dell’alimentatore, notare che si tratta di un impulso di bassa energia.


Nelle ultime versioni di PmtAdapter il rumore è inferiore ai 100uV. Praticamente il solo rumore dovuto al campionamento a 16 bit della scheda audio, come visibile nelle due immagini seguenti.


La prima immagine mostra il rumore della sola scheda audio, la seconda il rumore con il PmtAdapter collegato.
——————-
Il sistema completo


———————
Il Pmt Adapter non è in produzione, è possibile costruirlo ma contiene un certo numero di componenti speciali, difficili da reperire e costosi. Per cui si consiglia di rivolgersi ad Lello, che sa come reperire i componenti a buon prezzo e ha anche fatto stampare un certo numero di PCB per gli amici: ufficiotecnico@spray3d.it
Il team del sistema Theremino si occupa solo di ricerca e non vende hardware. Il sistema é completamente “Freeware”, “Open Source”, “No Profit” e “DIY”, ma esistono produttori che possono fornire i moduli assemblati e collaudati a un ottimo prezzo. Difficilmente si potrebbe auto-costruirli spendendo meno. Per un elenco dei produttori leggere questa pagina: www.theremino.com/contacts/producers
Uno zoccolo per il PMT Hamamatsu R6095 (e simili)


In questo file ZIP il progetto completo Eagle e il file GCode per la fresa: PMT_Socket


Queste immagini illustrano come adattare i connettori allo stampato e come viene lo zoccolo finito (fare click sulle immagini per ingrandirle)
Il condensatore potrebbe anche essere saldato dal lato opposto (con due tubetti isolanti sui reofori) e, per evitare cortocircuiti con il tubo di alluminio esterno, è bene avvolgere tutta la zona dal tubo PMT al circuito stampato, con un foglio di plastica isolante.
Un sistema MCA per Apple (iPhone e iPad)
A grande richiesta Alessio ha studiato una versione speciale di PmtAdapter, usabile con il software disponibile su iPhone e iPad. Il software si chiama Geiger bot, ed è un riferimento per la comunità Apple.

Lo schema elettrico è molto simile al PmtAdapter per PC, ma è stata aggiunta una batteria (non c’è la alimentazione USB). Inoltre il segnale viene ridotto notevolmente di ampiezza, per poterlo inviare all’ingresso microfonico, che altrimenti saturerebbe e distorcerebbe la forma degli impulsi.


Qui si vedono gli spettri ottenuti con Americio e Cesio. Grazie alla meravigliosa risoluzione dei display “retina”, le scritte sono così piccole, che non disturbano la visione del bellissimo sfondo nero.
Siamo lontani anni luce da un vero MCA, la larghezza delle righe “FWHM” (che è il parametro più importante per un MCA) è esagerata. I particolari minori dello spettro sono completamente invisibili. Ecco gli stessi spettri prodotti da Theremino MCA:


Con un Tablet 12 pollici da 180 euro (con Windows 10 e spedizione compresi nel prezzo), si avrebbe uno strumento portatile molto più comodo e preciso. Ma la soddisfazione di usare un sistema Apple, che costa una esagerazione, non ha prezzo!
Calibrazione e temperatura
Il Pmt Adapter e il fotomoltiplicatore consumano solo poche decine di milli Watt, che non sono sufficienti a provocare variazioni di temperatura significative. Quindi non è necessario attendere un “tempo di riscaldamento” tra la accensione e le misure. E non c’è nemmeno un riscaldamento progressivo durante misurazioni molto lunghe.
Però i cristalli scintillatori cambiano rendimento con la temperatura ambiente, come si vede nella seguente immagine:

Si noti che la risposta alla temperatura non è lineare e che cambia addirittura pendenza da positiva a negativa, proprio nella zona delle normali temperature ambiente. Per cui una correzione automatica sarebbe imprecisa. Ci vorrebbe una tabella di correzione da calibrare per ogni cristallo e questo sarebbe molto complesso e in definitiva poco affidabile. Molto meglio effettuare una taratura con due marker prima di ogni misura.
Effettuare un controllo con i marker prima di ogni misura è un sistema rapido, preciso e molto affidabile. Si consiglia di mantenere sempre in posizione due piccoli campioni (ad esempio Cesio e Americio) a distanze opportune, in modo da avere sempre due piccole righe di riferimento. Il Cesio è più debole e lo si tiene abbastanza vicino alla sonda mentre l’Americio lo si tiene a una decina di centimetri, oppure lo si racchiude in una capsula, per diminuire la sua attività e poterlo tenere vicino alla sonda.
Le due righe dovrebbero essere della stessa altezza e abbastanza piccole da non disturbare le misure. Se non si devono misurare proprio il Cesio e l’Americio, allora i due marker possono stare sempre in posizione. Vedere le loro righe sul grafico finale (eventualmente commentate) da la sicurezza che il grafico è perfettamente calibrato.
Costruire un pozzetto in piombo
Da usare per misurare il Livello di Radioattività del fondo naturale e di sostanze debolmente radioattive.
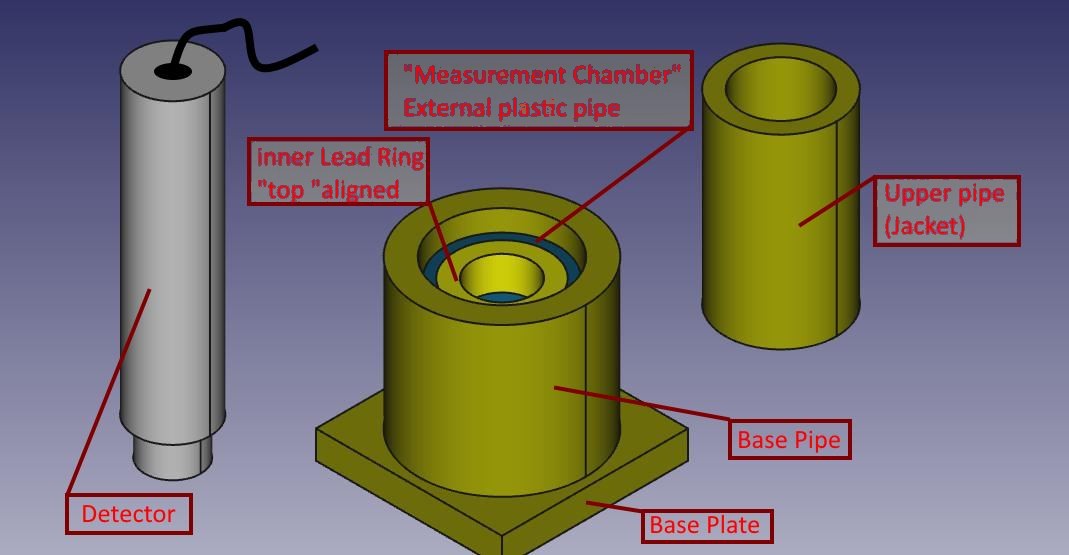
Il pozzetto di misura è costituito da una piastra di base, più alcuni cilindri concentrici, di varie misure e spessori. Tra i componenti si lascia un po’ di lasco, per facilitare l’assemblaggio.
Il materiale color ottone in realtà è il piombo, per distinguerlo dall’alluminio grigio della sonda, mentre il pezzo di cilindro interno (appena visibile) è l’unico di plastica, con anello concentrico e solidale in piombo.
Tutte le parti in piombo sono state realizzate a partire da lamiera da 1,5 mm di spessore, tagliata con una comune forbice da lamierino e sagomata a mano avvolgendola intorno a cilindri di alluminio/acciaio/plastica che avevo a disposizione (utilizzati solo come “dime”).
La piastrina di base è stata realizzata piegando più volte una striscia di lamiera di pari larghezza, ottenendo alla fine un discreto spessore.
La lamiera si piega facilmente attorno al bordo dritto di un tavolo e si appiattisce con colpetti di martello. Il piombo infatti è molto malleabile.
Tutti i pezzi sono stati avvolti con del nastro di carta sufficientemente largo, in modo che maneggiandoli non si viene in contatto diretto con il piombo, che tende sempre a sporcare le mani. Anche per questo è bene calcolare un po’ di lasco tra i vari diametri dei pezzi, in modo poi che il rivestimento di carta non crei problemi all’inserimento/sfilamento dei cilindri stessi, che parzialmente devono entrare uno dentro l’altro (come per il cilindro di base e la camicia superiore)
Per misurare si segue questo schema:
- Si pone innanzitutto su di un tavolo la piastra di base ed il cilindro di base;
- Si inserisce il campioncino da sottoporre a test dentro il tubo di base, in modo che sfiori la parte interna (più bassa) dell’anello della camera di misura: si possono infilare sotto ad esso degli opportuni distanziatori;
- Si mette la camera di misura (cilindro plastica ed anello piombo solidale) in modo che il sottostante campioncino sia centrato sul fondo dell’anello;
- Si infila la camicia superiore all’interno del cilindro di base: essa si appoggerà al tubo di plastica e si manterrà concentrica al foro dell’anello di piombo in modo da permettere il successivo inserimento della sonda;
- Si inserisce la sonda : nel mio caso a incastro nell’anello di piombo della cameretta di misura.
Dalle prove che ho fatto questo setup riduce il rumore di fondo da quasi 20 cps a 3,1 cps
Marco Russiani
Download di questo progetto, completo di ulteriori informazioni e immagini:
![]() Theremino_Pozzetto_di_Misura_ITA.pdf
Theremino_Pozzetto_di_Misura_ITA.pdf
![]() Theremino_G-Ray_Test_Chamber_ENG.pdf
Theremino_G-Ray_Test_Chamber_ENG.pdf
Hello,
Is there a way to use my RFT PMT M12FS52A with negative HV? I have a new and calibrated tube but they needs -1150 Volts. I can change the resistors but i dont know how.
many greetings, Patrick
Hi Patrick , the Photomultiplier tube can use positive or negative voltage , Theremino PMT adapter, use Positive with very low ripple , your tube can also use our Adpater , we suggest to use very high impedance such 10 Mohm for each dynode.
Please download our MCA software inside you can find some very useful docs ,and many example to use PMT. for any further question don’t hesitate to contact me at alessio.giusti@meteolink.it
Can anyone give some tips on removing the electrical noise from the adapter. My USB and cable are noise free but I’ve got a large signal at 500Hz + some higher harmonics which shifts around as the voltage is adjusted. I’m using a really thin piece of PCB copper as the shield, I guess that’s okay?
I used the Theremino Geiger kit and Theremino MCA software for testing of the radioactive contaminated solder mention in this report. Test your solder before use if you are constructing Geiger counter, or Scintillator equipment.
———————————————–
Accidental, and surprising detection of radioactivity in lead solder! (Preliminary Report)
I was sent this email from a person informing me about an accidental and surprising detection of radioactivity in lead solder that this person had purchased in Australia.
—————————–
Email 18th October 2013,
“Had my roll of electrical solder come close to my SBT 10, and started getting counts – Bloody great – tested it with my LND 7317 and averaged ~400cpm. Im doing a few more tests with sheet of paper, etc and will send a chart with results and maybe send a sample of the solder to Peter to try and see what the . is going on. Perhaps dirty lead?…”
—————————–
I received the first 12 gram sample late on the 30th of October, and started testing immediately. It took a while to complete multiple tests, plus do research on the test results. In my opinion the sample tests showed the lead solder to be significantly radioactive.
On the 8th November I contacted the company that had sold this brand of solder roll here in Australia. I spoke to the Australian product manager. I did this to inform the company of the detection, plus to provide the company with the opportunity to do further investigations into how wide spread and significant this contamination was. The product manager requested a sample for further assessment and testing, which I posted to him on the afternoon of the 8th of November 2013.
Later that afternoon a more senior representative phoned me, and freely volunteered the information that this solder was manufactured in China from recycled electronic circuit boards. They had been dealing with this Chinese supplier for over twenty years, and had not had any problems with this product before.
They said they would be transparent in their dealings with this detection, and provide feedback. I was sent a replacement roll of solder with a different product name, and it tested clean.
I phoned product manager on the 26th of November and was informed they were still waiting on the test results. When I heard nothing back from them, I rang on the 2nd of December 2013 to find out if the test results had been received yet. I spoke to the project manager again. He conveyed to me,
1. The test results had not been received yet.
2. The information conveyed to him, by the scientist doing the testing was it was mainly radioactive lead that was detected. He pointed out there was radioactive lead all around us in the environment, and in all lead. So it was unlikely that this contamination detection would be an issue.
In our discussion I pointed out that three contaminated rolls had now been detected in Australia by different people. (four now) In my opinion, the amount of radioactive contamination was significant, and way above what you would normally find in normal lead solder products.
Here is a Geiger counter test of 250 grams of a different brand of lead solder. This is solder roll sent as a replacement for the contaminated roll. As you can see from the test chart, it is at background level. This is how lead solder you purchase should test!
http://sccc.org.au/wp-content/uploads/2013/12/Normal-solder.jpg
Now compare that test to the test of 64 grams of lead solder, taken off the contaminated roll.
http://sccc.org.au/wp-content/uploads/2013/11/Lead-solder-64-grams-141113.jpg
There is a very large and obvious difference between the test results of normal solder, and the contaminated roll. Here is a more scientific long average Geiger counter tested conducted in the same background environment, for comparison.
http://sccc.org.au/wp-content/uploads/2013/12/Contaminated-lead-solder-compared-to-normal-solder-041213.jpg
I now have lots of reports from people who have tested a broad range of solder brands. So far, the contaminated detections are restricted to four rolls of this brand purchased in Australia. A contact in New Zealand has reported a clean test for newly purchased solder, including the brand in question.
Email Report: ( I have removed the company and product information from this email )
—————————————–
Hi Peter,
I popped into the branch in Wellington yesterday and bought a 200g roll. I also bought small samples of the 1.0mm version and their lead-less solder.
I then wandered up to the university and found a professor who works on such things. He placed the samples in front of his handy survey meter. There was no sign of radioactivity above the existing background.
This morning I’ve put them in front of my scintillator. Readings decreased by about 10%, perhaps due to the shielding effect of the lead.
All the best,
———————————————–
This evidence now suggests the contaminated solder is restricted to a batch sold in Australia. This is not conclusive. Unfortunately there does not appear to be any batch information provided on the product labeling.
My opinion
The radioactive contaminated lead solder could present a health risk under these circumstances.
1. If you didn’t wash your hands well after use, or touched other objects before washing your hands. Yes, I know, you should do this even if it was just plain lead solder.
2. Lead X-ray fluorescence, plus the significant amount Beta radiation released, could also be an issue if enough of it was in close proximity, eg. a wearable electronic device, or stored in large amounts.
3. Adults and children potentially breathing in volatilized contaminants on melting when soldering.
My big concern is children using this contaminated solder, when working on hobby electronics projects. Their greater potential for hand to mouth contact, and breathing in volatilized contaminants.
I have no idea how widely this contaminated lead may have been distributed. Has it been used in the manufacture of other electronic devices, or products that use lead? More investigation is needed to establish if this is the case. If you were building a Geiger counter kit or scintillator equipment using this solder, it would contaminate your project. At present, I would suggest anyone who uses lead solder for electronic projects to test it before use.
From the information conveyed to me at present, the company’s interpretation of the hazard appears to be different from mine.
At this point I and others have contacted the relevant Government regulators in both Australia and New Zealand. Health and safety complaint forms have been submitted to inform the authorities of the detections. We will have to wait and see what the outcomes are from this process. I will submit a more detail report once this process is complete.
The major issue here is Nuclear waste getting into the manufacturing process through poor control, regulation, and corruption. That everyone is a victim when this happens, manufacturer, distributor and consumer, plus the environment. These consumer goods will end up in land fills!
Test before use, would be the wisest action at present.
More Detailed Test Results
Because the first sample sent to me was sent to the manufacturer for further analysis, my contact sent me a larger 64 gram sample for further testing.
A Theremino Geiger counter Kit, + Russian SBT-10 pancake tube, was used for Geiger counter testing. The solder sample was in a zip locked plastic bag during testing. The lead in the solder would offer some self shielding.
This sample was from the original 200 gram solder roll. The Geiger counter testing of this lead solder detected mostly beta, a significant Alpha presence, plus a small amount of Gamma.
Gamma + Beta test result
1.6 uSv/hr
1000cpm
Geiger counter test chart shows that there was very little Gamma radiation detected, when an Aluminum Beta shield was in place.
http://sccc.org.au/wp-content/uploads/2013/11/Lead-solder-64-grams-141113.jpg
This Alpha test was done by another person with different equipment. Alpha test chart of the solder using a LND 7317 pancake probe. Unshielded 532cpm, with a piece of paper between solder sample and probe 332cpm. So approximately 200 cpm was Alpha Radiation 532 – 332.
http://sccc.org.au/wp-content/uploads/2013/11/lead-solder-with-paper-between-sample-and-probe-532-cpm-to-332-cpm.jpg
The main peaks in the scintillator testing appear to be for radioactive Lead Pb-210 at 46 keV and Lead X-ray fluorescence. The “Americium Am-241 ?” maker in this chart is not confirmed, and has a considerable amount of uncertainty associated with it. We will have to wait for the company’s final report.
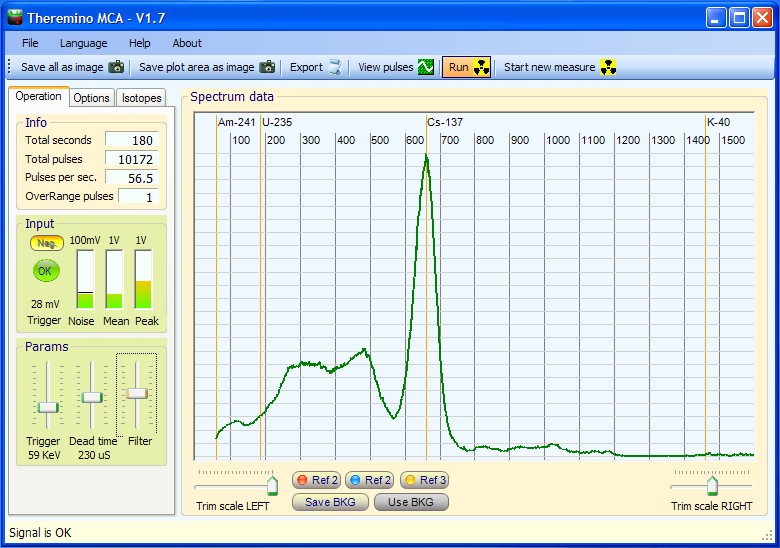
Here is a MCA Theremino software chart of a 64 gram sample of the lead solder.
http://sccc.org.au/wp-content/uploads/2013/11/Lead-solder-64-grams-221113-TV51-23c-45144.jpg
The best suggestion at present for the peak around 21 keV, is the X-ray fluorescence of another metal in the solder, eg., Rhodium, Palladium or Silver.
If you have any other suggestions for the peak around 21 keV, suggested follow up tests, or corrections to this assessment, please feel free to comment.
Disclaimer: This is an amateur volunteer run service. Human error can provide incorrect information, and equipment malfunction can produce false readings. Do not rely on, or take action upon information presented here, without further research.
Does your contact person still have any of this solder? I’d be interested in getting a small sample to use during talks on the surprising places where you have to look out for contamination.
In terms of “how did it get there”, if it came from China then it could be that some enterprising vendor there used reprocessed lead from something that was once used for shielding, e.g. bricks from a lead castle that had been activated through neutron bombardment (the normal decay chain would be coming from 226Ra from memory, but I can’t imagine it getting into the solder from that). So instead of disposing of it as waste, it was re-sold and reused in other lead products.
Hi,
I am Livio the Webmaster.
Probably the user “vital1” will not read your post. So, maybe, it is better to write directly to: admin@sccc.org.au
Thanks!
Please note that the Pb210 isotope is naturally present in traces because it is in the U238 decay chain. However this isotope is also synthetized into nuclear reactors so finding a substantial amount of it could be related to a contamination.
http://www.ozcoasts.gov.au/glossary/def_q-r.jsp
https://en.wikipedia.org/wiki/Decay_chain
Nice to see your nice measures to detect everybody’s radiological safety. Please go on with this investigation!
Left a more detailed comment in user section. Great software. Works well and the documentation is excellent.
June 2014 drain soil test, Caloundra Australia, using Theremino V6.2
I have a large 30 square meter concrete slab that flows into one drain. It is an uncovered area at the time of sample collection. It had become full of runoff. This runoff had formed a fine soil with fine plant roots throughout it. When I cleaned the drain out, I collected a 526 grams sample, and placed it into a marinelli beaker for testing.
This is mainly the soil, minus the fine plant roots. I did not dry it out, so there would be some water content.
Lots of Lead Pb-210!
When I do a scintillator test I usually have two MCA software programs running at the same time, Theremino and Becqmoni. This allows me to cross reference chart test results. Also, each software package has different advantages over the other. I used Becqmoni to work out the Pb-210 activity, in Becquerels per kilogram, for this soil sample.
http://sccc.org.au/wp-content/uploads/2014/06/Soil-from-drain-Caloundra-526-grams140614-TV62-22c-84695-+-text.jpg
The rest of the spectrum is a mixture of Uranium and Thorium decay daughters, plus some Be-7. The peak around 186 keV is most likely Radium. Maybe just a concentrating effect of the of Pb-210 from the large concrete surface area into this drain.
Here are some previous local soil tests using MCA PRA software. The detected amounts of PB-210 present in these tests is a lot smaller.
http://sccc.org.au/wp-content/uploads/2012/08/Local-soil-sample-880grms-230812-60-81.jpg
This one was a soil area, where a tin roof drained onto it.
http://sccc.org.au/wp-content/uploads/2012/09/Glenview-soil-sample-616-grms-060912-63.84-9.jpg
Hi !
I am the new owner of a Armadillo type-1 digital detector. I managed to obtain some Cs137 spectrums using Theremino MCA (nice software !). Though I have some difficulties to set it up properly. Would you help me with some questions ? I precise I made already many researches on the web and I have read the software manual.
– In the audio input section I don’t understand what are “bins” and therefore how to choose the proper value ?
– Concerning audio volume what is better ? Setting the microphone volume only through Windows mixer (and use MCA audio gain only if proper volume cannot be attained through Windows mixer) ? Or keeping the microphone volume somewhat low like 20% and adding some MCA audio gain ?
– Concerning calibration, I understood that in a first approximation I can calibrate on the Cs137 peak. But the eV values are not correct for other isotopes. Is this a probleme of linearity of the detector ? Which method do you recommend to correct the linearity ? I think it can be accomplished through the equalizer, but what is the proper way ? Calibrating for Cs137, then playing with equalizer to move peaks for different isotopes and energies such as Am241, Th, Uranium ore ?
– Last question : what is the proper method to set-up resolution compensation ?
Thanks :)
Hi Sebastien.
Each Bin is a single container for pulses of similar energy. Bins is a regulation of the resolution of the spectrum. With many bins there are many points in the spectrum but the time required to get a good spectrum is increased. So you regulate the “Bins” value to get a good compromise between resolution and speed.
If the audio card ADC is not saturated, every audio regulation is pretty equivalent. You can see if the signal is saturated using our DAA application (it works only on the default audio input, so you must set the windows default to the input you are using). Or you can see the saturation in the MCA pulse window. When pulses are saturated the top of the puses is flat. When the pulses are saturated the linearity of the high energy area becomes very compressed. If high energy pulses are near to the saturation it is better to reduce the Windows mixer gain, and compensate with the Theremino MCA audio gain.
To linearize with the MCA linearizer:
– put all the cursors in the “flat” position
– set the main regulator (the bottom right cursor) in the mid position
– regulate the Windows mixer audio gain and the MCA audio gain for a medium energy isotope (maybe radium or cesium)
– trim exactly the cesium with the main regulator (the bottom right cursor)
– place all the isotopes (americium, radium, cesium and cobalt) at right distances
(to see all the rows at the same time the distances are very different)
(uranium and thorium are non ok for the calibrations because rows are not well visible)
– set the test rows visibility for all the used isotopes
– regulate linearization cursors to get the best approximation for all the rows
(use keyboard arrows, and DO NOT OVERCOMPENSATE with exaggerate corrections)
(the linearizer cursors most be regulated smootly – nature NOT makes abrupt steps!)
There is not a method to regulate resolution compensation, only the experience can help you. The best hints are in the MCA documentation.
Thanks you very much for Livio your quick reply ! I will test your advices this evening :)
Another question related to calibration : Theremino MCA provides equalizers also for the height of peaks. How do I know the right height for a given peak or valley ? For energies / distances it is easy in theory as they have fixed values in ev, but for the height ?
The energy response of the scintillator chrystals (and also the geiger tubes) has a maximum near to 50-100 Kev and then decreases linearly. At 1 Mev the response is 200 times less.
https://www.theremino.com/uploads/Nai(Tl)_Response.jpg
https://www.theremino.com/uploads/Energy_response_and_filters.jpg
The energy response is also alterated by the sensor-sample distance, and by geometric considerations about their relative sizes. In these conditions to do amplitude measurements is impossible. Only some relative and approximate valutation can be done.
With the ThereminoMCA amplitude equalizer you can do an approximate correction of the response. But not to do measurements! Only to see better all the isotope rows. The correction is OK when you can see all the rows with similar amplitudes. Without the correction the strong rows tends to make disappear the little rows.
Hello Livio,
first a general comment: after I while I find it hard to find my posts. Only was is via google if I know a few keywords. Would it be possible to allow logins and a way to keep a list of all comments? Also that would allow to get some notification mail when there is a new comment. ( I did never get a mail and I checked spam as well…)
Here the technical thing:
I have a Scionix 38B57, because it has a length of 2,25″ I can get peaks as high as 2600keV.
Over the full range I find it hard to compensate with the equalizer. At least two or three more sliders would help here.
If you adjust the sliders it is hard to undo some changes because the slider position is not displayed => suggestion to show each slider position (-100-100%).
After all I still think that the equalizer should be modified. I mean when you compensate you have a bunch of reference materials with some lines you identified. Now, the task is to move the lines to the positions where they should be. Why not allow to enter those linese without too many restrictions (currently I cannot enter many positions as there are some rules behind that do not allow arbitrary keV entered)?
Last one: are the spectra exported with equalizer settings applied? If so, they should not, but the settings of the equalizer should be exported together with the spectra + the setting of the energy trimmer. That would allow to adjust the equalizer later and energies will be displayed correctly after you reload.
PS: I modified the isotopes list a lot and entered all possible escape peak energies as well. Also I addes SAMPLE rows for typical reference pieces that I got. Are you/anybode interested to get it?
Sorry, this blog does not support notifications.
We have created a forum with all the facilitations (send images, schematics with fidocad and notifications) here:
https://www.elettroamici.org/commmunity/forum/microcontrollori/theremino/
But it is new (only one post for now) and only in italian. The translator will be installed in the next weeks.
Theremino MCA modifications
What version you are using? I tested now the last version (7.2) and it is possibe to set the energy for each cursor.
I do not know if the other changes you propose are possible and / or desirable. In any case, these would be difficult changes, and we certainly do not have the time to implement them with the attention they would require.
The MCA application is open source and anyone can modify it, we will not reopen it unless we have serious bugs.
August 2014 Rain Water Test Report, using MCA Theremino V6.3 software
Station location
http://sccc.org.au/monitoring/Australian-Map.jpg
Summary:
Significant traces of Lead Pb-210 and Beryllium Be-7 were detected in the rain water. This is surprising considering the local background levels were so low for August. August 2014 had 209.6 mm of rain compared to July’s rain fall of 14.5 mm, so a lot more rain flowed through the filter this month. Beryllium Be-7 can be made by spallation in the upper atmosphere, during solar events, and takes around two weeks to reach the surface.
Lead Pb-210 is a decay daughter of Radon Rn-222. Because of the upper atmosphere damage, and a weaker magnetosphere, smaller solar events now have a greater impact on the Earth’s upper atmosphere. This is a possible explanation for the increased Beryllium-7 rain water detection here in August.
Roof down pipe filter design for rainwater testing, http://sccc.org.au/down-pipe-filter-design
Test Chart
http://sccc.org.au/wp-content/uploads/2014/09/Down-pipe-Caloundra-August-filter-test-030914-TV63-20c-97699-B-+-text.jpg
In this chart I have CPS on the Y axis to show activity, and have turned off Y log to show linear scaling.
Note: The name of the test chart screen shot has the testing detail in it, etc., date of testing 030914, (3rd September 2014), Theremino version 6.3 (TV63), temperature 20c and time of testing in seconds 97699, plus -B means minus background.
Previous Rain water and soil tests can be found here.
http://sccc.org.au/pages/The-Food-Lab.html#Soil%20Testing%20Results
An extraordinary interesting test, thanks!
To see all the SCCC tests follow this link: https://www.theremino.com/en/contacts/references/#sccc
One of this days I will go on the roof. In my roof there is a pipe that collects 16 square meters and sends the water to another roof. That point is on a terrace and it is very easy to work on it and to collect periodically the test material.
Help me, please, with some tips:
– The collected samples are stable over long time?
– You suggest to wait a long time between a collection and the next?
– Or it is better to collect a sample immediately after strong rain events?
A tip to insert images directly visible in the messages
———————————————————————————–
In the Vital1 message the image is inserted with the following syntax:
img src=”http://www.xxxx.yyyy.zzzz.jpg” alt=”Alternative name”/
All included in “< " and ">” symbols.
Feel free to experiment and make errors in your posts, if something goes wrong you can write to me another post with the corrections. I will do the corrections and then delete the “communication” messages.
“The collected samples are stable over long time?”
The polyester medium should stay stable for a long time. The filter is sun dried, and then placed in a zipp locked plastic bag. I have surgical gloves on when I handle these filters as you don’t known what the filter may have captured. After reomoving the gloves, the air is squeezed out of the bag and the zipp bag sealed. I do this out side on a clean surface. It is then placed in a scintillator test lead and copper shielded test chamber for testing.
“You suggest to wait a long time between a collection and the next?”
I could test the filters more frequently.
“Or it is better to collect a sample immediately after strong rain events?”
Testing immediately after each rain event could be implemented, it depends what you are looking for. This would be a good idea if you where looking for short lived isotopes.
Radon decay daughters can swamp the spectrum, and make it harder to detect trace isotopes.
I have been more interested at this stage see what I could detect using this system of sample collection, which is cheap and simple to set up.
The filter is made from two circular layers polyester wool around 1.5 cm thick.
The polyester wool is the same as you would purchase at a craft shop for making quilts or stuffed toys.
I also place a activated charcoal filter under this polyester layer to capture water soluble isotopes that may pass through the polyester filter.
So far the polyester filter has worked well.
The test chart in the above post is only a test the polyester layer of the rain water filter.
The polyester has a cleaner spectrum. Activated charcoal often has other contaminants in it like Uranium or Thorium daughters. This is from the wood or materials that were used to make the charcoal.
If the charcoal filter test is not showing anything different from the polyester filter, I only publish the polyester filter test results.
At present I aim only using this filter system to see what I can detect. I aim not trying to quantify the amounts detected at this point.
I just upgraded from Theremino MCA V6.3 to V6.7 and I see that the maximize window button is greyed out in this version. The main window can be resized to a maximum size of only 1024 x 720. Is there a setting I can change to make the window bigger?
I have another question please… When using background subtraction (Use BKG), is there a way to “Export pulse height histogram” and save the spectrum with the background removed? I think “Export pulse height histogram” exports only the current spectrum and not the background-removed data.
Thanks for your excellent MCA software!
Dimensione massima – ITALIANO
Gli utenti tendevano a usare enormi dimensioni in pixel. E questo creava molti problemi senza apportare nessun vantaggio nella visibilità.
– Il testo non si ingrandisce con alte risoluzioni
– Il grafico è perfettamente visibile anche con 1000 pixels
– Il consumo di CPU aumenta con le dimensioni
– Le immagini fatte con alta risoluzione diventano non usabili sul WEB
– … e non è più possibile ridurle altrimenti le scritte diventano illeggibili
– I due pannelli laterali devono sempre essere visibili e collegati a destra della finestra principale. Mentre con la finestra massimizzata spariscono.
Abbiamo spiegato queste cose ripetutamente, ma quasi tutti gli utenti continuavano a usare dimensioni assurde, anche oltre i 2000 pixels. Per cui alla fine abbiamo deciso di bloccare la massima dimensione. Per modificare questo si deve aprire il progetto con VisualStudio 2008 e cambiare le proprietà “MaximizeBox” del Form da FALSE a TRUE. Ma, come scritto, sconsigliamo di farlo.
Esportare la sottrazione del fondo – ITALIANO
Mi spiace ma questa possibilità non è prevista. Aggiungere una riga al menu file potrebbe sembrare facile, ma in realtà richiederebbe un gran lavoro. Chi esporta i file per vederli su altri programmi può farli sottrarre al programma visualizzatore, ad esempio Excel.
Maximum Size – ENGLISH
The maximum size is locked because users tended to use huge size in pixels. And this created a lot of problems without making any advantage in visibility.
– The text does not zooms with high resolutions.
– The graph is clearly visible with 1000 pixels.
– The CPU consumption increases with the size.
– Images taken with high resolution become unusable on the Web.
– And you can not reduce them, otherwise the text become unreadable.
– The two lateral panels must be always visible and connected to the right of the main window. But with the window maximized they disappear.
We explained these things repeatedly, but most users continued to use hige sizes, even above 2400 pixels. So in the end we decided to lock the maximum form size. To change this, you must open the project with VisualStudio 2008 and change to TRUE the “MaximizeBox” property of the form. But, as written, do not recommend doing so.
Export Background Subtraction – ENGLISH
I’m sorry but this possibility is not provided. Add a line to the file menu might look easy but actually require a great job. When exporting files to see them on other programs, it is possible subtract them by the viewer program, such as Excel.
Ancora riguardo alle applicazioni a tutto schermo:
Il numero di pixel che si impostano nelle proprietà di Windows, deve essere adeguato alla larghezza del monitor che si usa. Se si esagera con il numero di pixel, non si leggono più i testi di dimensione normale. Per usare 1600 o 2400 pixel e poter leggere le scritte, ci vorrebbe un monitor davvero enorme (40 o 50 pollici).
Sconsigliabile anche “barare”, impostando pixel esagerati e poi ingrandendo le scritte, nelle proprietà di Windows. In questo modo si sprecano inutilmente risorse e CPU. Ma peggio ancora! Tutti i controlli grafici vanno fuori posto (e a volte le scritte non stanno più nei riquadri).
Mi scuso per le ripetizioni e i miei modi rudi, ma vorrei chiarirlo bene:
– Ingrandendo le applicazioni a tutto schermo, le scritte rimangono esattamente uguali, non si ingrandiscono di un solo pixel, e non diventano più leggibili.
– Ingrandendo le applicazioni a tutto schermo, le righe del grafico non si ingrandiscono.
– Quello che si ottiene è solo, di aumentare le dimensioni delle aree vuote, che non danno nessuna informazione aggiuntiva.
– Ma come effetti collaterali: il Desktop non è più disponibile per nient’altro e la CPU lavora molto di più (con il quadrato del numero di pixel).
Dear all,
I recently installed UBUNTU 14.10 and Theremino 6.7 .
https://www.theremino.com/en/downloads/linux/ explains the process, but I had to do slight
changes with the new system (64Bit). I share them below so you can save some time.
please let me know of mistakes then we can keep it uptodate
Best
Erich
1) erich@newlife:~$ sudo apt-get install wine1.7
2) erich@newlife:~$ sudo apt-get remove wine-mono
3) if you are on a 64 bit linux create a 32 bit wine prefix for
Theremino as the dotnet will not work on 64 bit
Only 64 Bit:
create prefix:
erich@newlife:~$ WINEARCH=win32 WINEPREFIX=/home/erich/.wine32 winecfg
erich@newlife:~$env
lists the environment variables it sould now also contain
WINEPREFIX=/home/erich/.wine32
if not then type
erich@newlife:~$ export WINEPREFIX=~/.wine32
4) dont use the winetricks from Ubuntu, download the freshest one
from http://winetricks.org/
5) erich@newlife:~$ chmod + x winetricks
6) erich@newlife:~$ sh ./wintetricks corefonts (if on 64 bit use the correct wineprefix)
on 64 bit: if it does not install into your 32bit wine the always use it with the wine prefix:
WINEPREFIX=~/.wine32 sh ./winetricks corefonts
7) erich@newlife:~$ sh ./winetricks dotnet30 (if on 64 bit use the correct wineprefix)
will take care about the installation of all necessary previous
packages (if you install dotnet20sp2 before it will conflict with dotnet30)
8) erich@newlife:~$ sh ./winetricks gdiplus (if on 64 bit use the correct wineprefix)
9) Install the run-time Microsoft VisualBasic6 doing right mouse button,
run with Wine, executable here indicated:
erich@newlife:~$ wine vbrun60sp6
install
https://www.theremino.com/wp-content/uploads/2012/03/vbrun60sp6.zip
10) Install a version of Adobe Acrobat Reader compatible with the
operating system emulated by Wine, for example by running the following
Setup with Wine:
download https://www.theremino.com/wp-content/uploads/2012/03/acrobat405.zip
install
erich@newlife:~$ wine acrobat405
11) i made a scripot which can be started via an icon from the menue panel:
#!/bin/bash
WINEPREFIX=”/home/erich/.wine32″ wine /home/erich/software/Theremin/Theremino_MC/Theremino_MCA.exe
Thanks for your experiments.
The Microsoft Visual Basic 6 is not required by Theremino applications. We suggest to install it only to use some old utility or program written in VB6.
Una domanda, ho trovato la scheda audio USB consigliata ma mi chiedo se i 44 kbit/s di campionamento siano sufficienti, il programma funziona anche con schede audio con campionamento piu’ elevato? Non vedo opzioni al riguardo ne’ nel DDA ne’ nell’MCA!
Non sono 44 kbit ma 192 kbit.
Il DAA funziona sempre a 192 Khz di campionamento.
Nel Theremino MCA si deve impostare “Camp. = 192000”
Se trovi una scheda audio con più di 192 kbit allora potrai impostare 384000 o 768000. Ma il miglioramento oltre i 192 kbit sarà minimo e in compenso dovrai sopportare un maggiore rumore di fondo. Un maggiore rumore di fondo maschera le energie più basse e ti costringe ad alzare il parametro “Energia min”.
Con le schedine modificate secondo le nostre istruzioni (e cablate con cura), si arriva a Energia Min = 2 KeV, un livello di rumore così basso che nessun hardware similare, anche di famose e costose marche, è mai riuscito a raggiungere.
La scheda audio da noi modificata ha due vantaggi:
– Fornisce alimentazione lungo lo stesso cavo che porta il segnale (in questo modo non si creano loop di masse e si riesce a tenere il rumore nella zona dei microvolt).
– Contiene un filtro passa alto, che elimina i rumori a bassa frequenza, e migliora di molto, la stabilità della linea di base.
Con una scheda audio “normale”, per quanto tu la possa pagare centinaia di euro, non potresti mai raggiungere i livelli di rumore e di FWHM incredibilmente bassi, che si ottengono con le schedine audio modificate.
Ti ringrazio della risposta ma….non per contraddirti ma la chiave USB audio citata nella documentazione (quelle celestina trasparente 3D sound) ha un chipset che campiona a 44/48 Khz. Come fa il DAA a campionare “sempre” a 196KHz indipendentemente dall’hardware che possiedo? Se lo fa’ e’ un campionamento finto. Infatti a me nel DAA la frequenza massima si ferma 22 KHz (Nyquist su 44 Ksample/s). C’e’ qualcosa che non capisco?
In altre parole che chiave USB devo usare? Quella suggerita non va oltre 48 Khz di campionamento. C’e’ qualcosa di meglio in giro? Chiavi USB audio da 192 Khz non ne ho trovate!
Sappiamo che i chipset “dovrebbero” essere da 48 Khz, abbiamo raccolto tutti i data sheet che siamo riusciti a trovare e ne abbiamo anche tradotti dal cinese. Ma i chip che montano attualmente i cinesi non sono quelli dei datasheet. Non si può sapere cosa sono perché c’è una goccia nera e nessuna sigla. E se anche avessimo la sigla esatta i cinesi non hanno ancora reso disponibili i data sheet aggiornati.
Però (da almeno due anni) tutte le schedine audio USB che abbiamo provato campionano a qualunque frequenza da 1 a 199 Khz. E (almeno da 5 anni) anche tutte le schede audio interne ai PC campionano fino a 199 Khz. Se non ci credi usa un qualunque software che possa impostare il campionamento in modo continuo, Hertz per Hertz, e prova tu stesso.
Inoltre il 192 Khz è un campionamento vero, non interpolato, se non ci credi, hai solo da verificarlo con Theremino MCA:
– Imposti 44 Khz, fai una acquisizione e salvi la curva di riferimento
– Imposti 192 Khz fai una seconda acquisizione e confronti.
La differenza è evidentissima sia nel rumore che nello FWHM
Noi abbiamo provato decine di schede audio di ogni tipo (anche schede audio molto costose), se scriviamo di usare le schedine USB blu è perché sono quelle che vanno meglio.
In ogni caso qualunque scheda audio andrebbe modificata. Altrimenti non si raggiungono le prestazioni di rumore e FWHM cui siamo abituati. Modificare le schedine USB è facile ma modificare una scheda grossa e costosa potrebbe essere molto difficile.
Grazie, ho provato ed effettivamente con MCA posso settare 192 Khz….ho acquistato 6 chiavi USB (identica a quella consigliata). Pensavo di modificarla co0n l’induttore (ne ho da 470 uH 0.3 Ohm) e poi di richuderla con del termorestringente (l’induttore e’ grosso). Domande: E’ disponibile lo stampato? Alcuni componenti non li possiedo, so che non fate kit ma c’e’ qualcuno che ha collezionato qualche sottoinsieme di componenti non di faile reperibilita’?
Per ultimo, se DAA campiona a 192 kHz perche’ la massima frequenza dello spettro e’ sempre e solo 22 Khz? E’ un vincolo software? C’e’ un fattore 9 tra la frequenza di campionamento e la massima frequenza dello spettro. E’ voluto?
Se esagero con le domande dimmelo…
Lo stampato per l’induttore? Se invece intendi lo stampato del Pmt Adapter dovresti chiedere a Alessio (che non è un venditore ma a volte ne fa per gli amici).
Se usi l’induttore al posto del limitatore di corrente fai attenzione che poi non devi fare corti circuiti nel jack di uscita. Altrimenti l’induttore si cuoce.
Il limite a 22 KHz è dentro allo ADC delle schede audio. Dato che sono fatte per campionare audio, hanno tutte il filtro anti aliasing a 22 KHz. Anche le schede costosissime e con frequenze di campionamento esagerate hanno il filtro a 22 KHz. Sarebbe carino trovarne filtrate a 100 KHz, e pure stereo, per il DAA, ma quasi certamente non ne esistono.
Prevengo la tua prossima domanda: Perché campionare a 192 KHz se poi si filtra a 22 ?
Risposta: Si chiama sovra-campionamento e ha molti effetti benefici, sia nel sopprimere perfettamente ogni aliasing, sia nel ridurre le prestazioni richieste al filtro di aliasing (i primi lettori di CD, prima di inventare il sovra-campionamento, avevano filtri anti-aliasing mostruosi, anche da 96 decibel per ottava)
Inoltre un campionamento a 192 KHz, fornisce più campioni al software che viene dopo. E i campioni, più vicini tra loro nel tempo, forniscono una maggiore precisione, nella misura esatta, della tensione di punta, di ogni impulso.
In definitiva, dato che gli impulsi del Pmt Adapter, hanno la massima energia, nella zona dei 10..20 KHz il campionamento a 192 KHz, con filtro a 22 KHz è proprio l’ideale per noi.
Questi argomenti sono meglio spiegati nel file MinimizingFWHM, scaricabile da questa pagina:
https://www.theremino.com/downloads/radioactivity#mca
A pagina 13 trovi lo spettro, del segnale che ci interessa, e a pagina 15 si vede un impulso, che viene campionato con ben 20 punti, grazie al campionamento a 192 KHz.
—————
Perché, le frasi di questo sito, contengono troppe virgole?
Perché altrimenti, il traduttore automatico, fa fatica a capire, e traduce male.
My first USB stick I ordered did have the “black dot” over the chip and did not work, so I am looking for two others to come.
For the time beeing I was wondering to find a workaround without the need to modify more expensive cards.
What do you think about it?:
– some cards (like Steinberg UR22 or other evem more expensive ones) offer an equalizer for the input, so I thought I could apply a similar band pass filter than your filter circuit does. Shouldn’t it be the same? (I am not finished with testing, but so far the side-effects of other software I used was bigger than the benefit)
-there is a free (donation ware) software available (Voicemeeter banana) that allows to apply sophisticated filters on inputs.
– also in order to avoid the “power over audio” supply that your card modifiction offers I am using a Li-Power bank, so I have also no ground loops.
I will update as soon I have more test results, but would be happy to get your feedback if you think that’s the right way…
Sorry, i do not know better solutions. In my opinion a software filter will not work, every component you add (software or hardware) will introduce more noise.
Also to use a battery is a poor solution (because of the periodic recharge needed).
I suggest to buy some cheap audio cards and modify them as described in our documents. It is not so difficult.
Hello Livio,
well, my biggest hurdels to decide for the Theremino MCA was that I could not get all from one hand. I bought 10 (ten) USB cards like the one you suggested and only two of them are fine in regard of noise. But they are finally different to the the description, so the modification would be harder to do.
Finally I am happy to get a USB Fireface card from RME (OK for 700€ this is far to much for that pupose) and that card provides 0.3mV PP with everything connected. This is OK for me, but not everybody may simply rent such a nice card.
I did not proceed with the SW filter because it works sometimes, sometimes not. If it works (BP filter 200-7kHz) it produces inredibly low noise of 0.15mV PP together with the RME. Also, it is worth mentioning that the RME is the only card I found that really has a bandwidth of 80kHz at 192kHz sample rate.
Anyhow here is my suggestion: wouldn’t it be possible to provide a combined solution PMA and soundcard on one board together?
OK, the coundchip is pretty hard to solder, so maybe if you could offer this card prefabricated or get some partners on board that would be best.
Any other solution is pretty much experimenting. And because no other card has your zero-pole compensation an additional filter will have negative effect on the result…
I am using a CZT detector type eV B1705 which has 4 x 5x5x5mm in parallel it has the built in IC amplifier and seems to operate well enough with 60V dc bias to the detector.
Running on Theremino MCA for a while with Ra226 instrument dial as source I get a large result which i can move as far across as 60 KeV if i set the shift slider all the way to 1200.
Is there anything I can do to adjust the graph to line up with the calibration?
https://dl.dropboxusercontent.com/u/77614660/Theremino%20CZT%20Ra226.png
my screen dump may help show if I have any settings incorrect
Thanks for the very useful program, I am still learning
Ralph, NZ
Only with our Pmt Adapter and a PMT connected with a modified USB card (and following all our wiring advices), it is possible to see low energies, down to about 2 KeV.
CST detectors and commercial amplifiers (also for photomultiplier tubes) are noisy. Have you noticed that in our site we never advice to use, CZT and PinDiode detectors?
Looking at your image it is also visible that the Audio Gain is about “6” (three times the “2” we use normally) and that the “Energy trimmer” is in the maximum position (another 2 times of amplification). So your signal is about six times lower, than the normal signal of our PmtAdapter. With a so low signal the signal-noise rapport is further reduced.
Probably the only solution is to raise the parameter “Energy min” to 100 KeV and lose the low energies.
Sto cominciando a giocare con il software (spero che Alessio riesca ad aiutarmi almeno con il PCB dell’adattatore) ed il rumore della scheda audio ed ho una domanda (forse banale e dovuta alla mia ancora scarsa conoscenza del sistema Theremino). A quanto o capito per eseguire la taratura della scala delle energie si gioca con il gain fino a portare il picco della sorgente nota all’energia attesa, dopo si cerca una minimale correzione con l’equalizzatore per compensare le non linearita’. Domanda…avendo piu’ righe (piu’ isotopi noti) non e’ piu’ preciso e sicuro cercare un fit polinomiale Energia-bin prendendo tre o 4 punti nei quali c’e’ un picco di energia nota? Mi pare che il PRA abbia la possibilita’ di farlo. Ai tempi ho usato all’uni un MCA e si faceva cosi’! Il punto e’ che gli slider danno poche informazioni, non capisco bene cosa sto facendo e spostando uno slider modifico la forma della curva in modo poco chiaro e no sempre prevedibile. Un fit mi pare piu’ opportuno….magari sbaglio e si puo’ gia fare…oppure potrebbe essere una idea per una versione futura del software. Fallo tu! mi dirai…Purtroppo programmo in C++ ( con GCC ) e non ho l’ambiente Visual Basic….ma non dovrebbe essere una modifica complicata.
Nelle ultime versioni di MCA gli equalizzatori sono parametrici, quindi puoi scegliere per ogni cursore, una energia che corrisponde a un picco di energia nota, esattamente come fa il PRA.
Nelle ultime versioni, anche la quantità di intervento è regolabile, e questo rende molto più delicata la regolazione, quando si deve intervenire poco.
Inoltre i cursori sono regolabili, anche con le frecce della tastiera, per regolazioni molto fini.
La forma della curva non si vede ma è facile da capire:
Quando si regola “Cubical interp = 0” è una spezzata che passa per i punti stabiliti
Quando si regola “Cubical interp = 100” la spezzata si arrotonda un po’ negli spigoli
C’è anche un test che riempie i bin di dati tutti uguali e permette di vedere come si comportano i cursori. Per fare il test si deve fermare il RUN dopo un secondo esatto di campionamento e poi premere il pulsante “Test” degli equalizzatori.
Here is a Theremino 6.7 test chart of a Thorium gas mantle, showing the different gamma emitting radioactive isotopes present in it. In this test I have maximized the low energy sensitivity in Theremino by using a small bin size, and used the “Equalizer Master” to increase resolution for the higher energies.
Here are the isotope peaks I have been able to identify so far. There are at least three I have not identified yet. Testing time was 3000 seconds.
http://sccc.org.au/wp-content/uploads/2015/04/Thorium-mantle-TV67-calibration-110415-3000.jpg
Old Thorium gas mantles are highly radioactive, and in my opinion a radioactive dust hazard, particularly if they are in old packaging. Anyone who is not experienced in handling radioactive material should not purchase old Thorium gas mantles.
If the dust gets into your test chamber, it will contaminate it. So if you have one, make sure it is an air tight sealed container before testing.
I am amazed that they actually sold these to the public.
I am amazed about your low-energy range and resolution. Is there any special trick?
I am using the gamma spectacular GS1100Pro and currently I am far away from that. But I am also just starting, so let’s see how good I get…
Hi Livio,
Is the new deconvolution feature explained somewhere ? As I see it it seems to allow user to “cheat” with spectrum by moving and smoothing peaks where the isotopes bars are. I would like to know how to make a proper use of it :)
Many features of the MCA can be used to cheat. For example the “Linearizer” can be used to produce an incredibly low FWHM on a single row. And the “equalizer” can be used to modify the relative height of the rows.
The Theremino MCA is designed to use for themselves and is not suitable to produce certifications.
The super deconvolution is explained only on the download page in the notes to version 6.7. The translation is automatical and approximative, so I try to copy and correct it a little in this message:
Threremino MCA – THE SUPER DECONVOLUTION
The new Super deconvolution of Marco Catalano is able to drammatically tighten the rows. It starts from some assumptions:
(1) To know which are the isotopes which create the curve.
(2) Be sure that the influence of the not considered isotopes be negligible.
(3) To kow (and set in the “Deconv Size”) the width of the Gaussian produced by the crystal.
If the assumptions are valid and the regulation of “Deconv Size “is correct, then it is possible to calculate exactly, the activity of each isotope. The lines can be narrowed with the parameter “Gaussian Size” and the results are very similar to those obtained with the expensive high purity Germanium detectors.
If you adjust “Gaussian Size” to zero, then the activity of the selected area (Deconv Size) is concentrated in a single BIN. Then it is possible to send the CPR values to the Theremino System Slots. Enabling “OnlySelectedRows”, each selected row will be sent to a different Slot. This way you can get simple Bequerel values, without the complicated, cumbersome and arbitrary, manual adjustments of ROI (Regions Of Interest).
Hello, can I attach a hardware comparator to the PmtAdaper’s output to count/convert the impulses with/to a µC like Arduino or a MSP430 chip (counting falling edges, attachInterrupt(P1_2, count, FALLING);) (and display the value on a LCD then)? This could be an inexpensive, open source, ratemeter.
Yes, it is possible, but with very limited features.
To create a portable instrument it is better to use ThereminoMCA and ThereminoGeiger on a tablet (or WindowsPhone).
Or to use an iPhone, iPad or WindowsPhone, with an App that reads the pulses via the audio input, as shown here:
https://www.theremino.com/blog/gamma-spectrometry#apple
Is the ThereminoGeiger only for Geiger-Müller tubes? (at least the name suggests it, otherwise it should be called ThereminoRatemeter).
I’m not sure what you mean by “very limited” but I only need impulses which I would feed into a µC, it’s already working with a Geiger counter and I can display a CPM reading.
I’m not interested in using something as proprietary as iPhone or anything from Apple for that matter (I’m a Linux user and no closed source software comes on my PC (yes I’m aware of kernel blobs too – gNewSense. Let’s not talk about hardware, I know it’s closed). Also, iPhone or something typical Android based doesn’t have a long battery life. So I’d rather use a Nokia 5110 + MSP430 and it’s LPM3 with interrupt counting. The highest power consumption would have the Theremino PmtAdapter, 10mA, and which is much more than the MSP430G2553 + Nokia 5110 LCD but the total consumption (10mA+0.1mA) is still much less than using a tablet, smartphone or something. Yes, it’s ratemeter only, no spectrum. (Batteries are one or two 18650 with approx. 3000mAh and with 10-20mA power consumption, this would last much longer than those unsuitable tablets / smartphones. Yes for spectrum they are good because of their OLED/LCD displays but I’m only interested in counting/ratemeter.)
The Theremino Geiger is a ratemeter. The first versions was working for Geiger tubes only, but now we use it also for ion chambers, and to count scintillator pulses.
But if you are interested to a very low consumption, both Theremino Geger and PmtAdapter are not ok. Maybe you can take a look to the Theremino Checker:
https://www.theremino.com/en/hardware/inputs/radioactivity-sensors/#checker
and to Theremino Ratemeter:
https://www.theremino.com/en/hardware/inputs/radioactivity-sensors/#ratemeter
And also the GeigerAdapter (only 10uA of supply) could be interesting:
https://www.theremino.com/en/technical/schematics/#geigeradapter
Checher, Ratemeter and GeigerAdapter can work for some years with a single aaa cell.
Sorry if I have not understood well the problem, my english is not so good…
Thanks for the suggestions. I should have mentioned that a big feature of my DIY ratemeter is that it should go higher than the typical 500k CPM, which can be maxed out very quickly, otherwise I could just buy such a commercial ratemeter. Oh, wait, I can’t, they are too expensive even used ones from ebay and not. That’s why I want to build one myself. Another advantage of course is that the source code for counting and showing counts on the LCD is open source and the hardware repair is much easier.
After doing some search, I think that a typical PMT power supply consumes 10mA to 100mA (max) at 5V to 12V. So, it’s not low-power but I accept it. I then need to convert the impulses from the PMT’s output so that a microcontroller accepts them. Something like this: http://www.maximintegrated.com/en/app-notes/index.mvp/id/2236 (the PIN diode can be replaced with a PMT):
“The op amp shown in this circuit (MAX4477) enables this design. It has negligible input-current noise and exceptionally low input-voltage noise: 3.5 to 4.5nV/RtHz at the critical frequencies of 10kHz to 200kHz. Its input capacitance is a respectably low 10pF.”
The high value of 200kHz is what I need. The output signal is converted to something that a microcontroller can read now (see second picture down below, rectangle impulse). I’m not sure if your suggestions can fulfil these needs (e.g. are they fast and stable enough). But maybe you could build/sell this maximintegrated’s “Gamma-Photon Radiation Detector” schematic (I’d buy it as kit or soldered). Or is there something similar in one package? (I think I prefer this way because it allows someone to choose any PMT power supply, like a Hamamatsu C4900, and then converting the PMT’s signal to a suitable µC signal).
The Maxim schematics is for a PIN diode. To amplify a PIN diode requires a circuit completely different that to amplify a PMT.
The 200KHz specified by Maxim is the band-pass and is related with the pulses lead and fall times, but I guess that you are interested to count pulses up to 200 K per second. And this appear to be very strange… you will never find a so strong radiation in your life! And if the radiation will be so strong I suggest to go away very fast, instead to make measurements!
Please write what exactly you think to do and then I will try to suggest the best solution.
You plan to use a PMT?
The model of the PMT? (there are many very different types requiring different circuits)
The PMT will be coupled to a scintillator crystal?
Material of the crystal?
What range of energies will be emitted from the isotopes you need to measure?
How many Bequerels are emitted by those isotopes?
I’ve been said that the PIN diode can be replaced with a PMT. Of course I’m planing to use PMTs, these Hamamatsu PMTs in fact: R1450, R647, R6095 with BGO and 1″ NaI(Tl) crystals. Range is typical: Cs-137, Sr-90 stuff. (Basically never over 3MeV.)
The old Eberline ASP goes up to 10M CPM and ESP also up to a few M CPM.
“but I guess that you are interested to count pulses up to 200 K per second” exactly.
I’d be happy with up to 100 CPS (=6M CPM). It’s just that 500k CPM can easily be maxed out and that is annoying and unprofessional.
” How many Bequerels are emitted by those isotopes?”
That’s what I want to know then without maxing out those 500k CPM, which can be easily reached with scintillation.
“you will never find a so strong radiation in your life! And if the radiation will be so strong I suggest to go away very fast, instead to make measurements! ”
It’s not really about that (in Chernobyl you can find >100mSv/h sources BTW), it’s just that 500k CPM can be maxed out with a simple legal 1µCi check source. At least a few M CPM would be necessary.
I still want to try it using a PMT HV supply + something like the Maxim’s schematic. Maybe you can suggest me something (or build and sell me Maxim’s schematic or as kit XD). I have already working counting code with a MSP430 (MSP430G2553) (http://forum.43oh.com/topic/6198-low-power-geiger-counter-with-msp430g2553-last-updated-may-07-2015/). I just need to have the impulses come from a different hardware now.
The Maxim schematics is not for the PMT tubes.
Our PmtAdapter, with a slightly different output circuit, is exactly what you need.
Please write to Alessio that has already maked similar cuircuits and has the schematics. Alessio could also send to you a KIT or the complete adapter.
Alessio: makers@theremino.com
Regarding the 3.5mm input jack on the sound card… wouldn’t it be better to have GND-signal-5V rather than GND-5V-signal, so that the problem of short-circuiting the power supply cannot occur?
Thanks.
The disposition GND-5Volt-Signal is used in all the commercial sound cards, we can not change this tradition. In addition with the GND-Signal-5Volt, if extracting the jack about 5 or 6 mm, then there is a point that connects signal to ground, and 5Volt to Signal, potentially damaging the OpAmp. And there is always a position that shorts the 5 Volt to ground. The only good solution is to use a current limiter as in our modified sound cards.
OK thanks. Also in the pdf you mention that the Zener must be low leakage. How low should the leakage current be, and under what test condition?
They are rated less then 100 pico ampere at 100 C
In the ON Semiconductors DataSheet of the MMSZ5221BT1 Series, there is a “Figure 8. Typical Leakage Current” that shows this.
If not using low leakage zeners, when the temperature increases over some value, the voltage could drop by hundred of Volts.
Very few zener diodes are OK for this, the possible choices are:
MMSZ52xx OK up to 110v
MMBZxx (but max voltage models are 90 Volt)
MMSZ4xx (but max voltage models are 43 Volt)
MMSZxx (but max voltage models are 56 Volt)
Grazie.
I am user of Thermimo 6.7 and I find it very useful for xrf.
Got 2 simple questions to ask.
How long do I have to wait before starting measurement using NAI detector?
Is there a temperature drift in readings after prolong use.?
Thanks
Hi,
there is no need to wait before starting measurements.
There is nothing that heats itself, and so there is nothing that changes in the first minutes or after a prolonged use.
But, because the room temperature changes the chrystal response, then it is always a good practice to do a calibration with two markers (for example Americium and Cesium) before to start any new measurement.
To get always the maximum precision it is recommended to redo the calibrations before to start EVERY measurement.
It is easy to do this if you place, and mantain always in place, two little samples at a appropriate distance. Normally Cesium very near and Americium at about 10 cm from the crystal. The right distance produces two little marker rows, not disturbing the measurement but very useful to mantain always calibrated your system.
Livio,
Thanks for the reply.Sorry I din realise it was explained on your website above.
Another query you mentioned in this forum regarding G.deconvolution with some assumptions.Can I use in the Xrf section too?
Thanks again.
Yes, but remember that with incorrect assumptions the deconvolution could produce completely wrong graphs.
Ok..
What happens if I press resolution compensation and Deconvolution together assuming I got the right assumptions.?The reason why I ask this is I don’t need R. compensation with already good Deconvolution.
Thanks
Resolution Compensation respects the real data and does only a little correction.
I do not know what exactly will happen with your samples, using Compensation only, Deconvolution only, or both the methods.
So I suggest to start with the Resolution Compensation only (that is a good and sincere basis), and to add the Deconvolution, when you will know exactly how many rows are really present and significative.
Hi,
there is a new image about the temperature dependance of the scintillation chrystals.
https://www.theremino.com/blog/gamma-spectrometry#calibration
Eventually you could read the automatic translation here:
https://www.theremino.com/en/blog/gamma-spectrometry#calibration
Thermimo starts reading immediately after loading once I double click the icon.The first reading is messy especially when I use Resolution compensation in version 6.7.I normally press the “Start new measurement” to get a proper second reading.Is there any plans in the future to prevent Thermimo was loading and reading at the same time.
Lastly I like to congratulate you for this excellent software.
Thanks
After loading the applications Theremino MCA
and before to make any significative measurement,
it is imperative to do the following things:
– Test calibration with one, or better two, radioactive samples
– Place the sample to be measured in a stable position
– Press the “start new measure”
Otherwise you could use the a short “integration time” (for example 60 to 600 seconds)
in this way the instrument uses only the more recent history
and to press the “start new measure” is not required.
Apart those considerations… why your “first reading” is messy?
We can not reproduce this (but we use normal radioactive samples, not xrf).
Can you please indagate what happens with more precision?
I suggest also to use our applicazions for a long time, and to read all the documentations, in order to become familiar with the general principles, before to write to us what really happens.
The idea is to transform the word “messy” in a precise documentation:
– Maybe the audio card starts after the MCA producing son spurious noise?
– Maybe it is a timing problem?
– Maybe there is some incorrect regulation in teh Windows Audio Mixer?
– For example the Microphone preamplification or AGC are active?
– It happens at every RUN?
– It happens only when the start coincides with a WindowsSystem Start?
– Etc…
We are testing for your problem.
Are the first 5 or 10 pulses changing your graph significativally?
Are your analisys based on a very limited number of events?
In this case you are sampling for a too little time, and your graphs are affected not only by the first pulses, but also by the randomness of the radioactive data.
Normally a good and reliable graph is based on a minimum of 1000 or 10000 events
and so the first some pulses are absolutely ininfluent in the whole randomness of the data.
Please send to us some image with the “Operation panel” options visible
Maybe also two images, one with the problem and one without the problem.
Please send the files to: engineering@theremino.com
Ok let me rephrase.
Thermimo 6.7
Soundcard set at 192000/24 bit/studio at the control panel sound settings Win7
Use Thermimo set at x50 bin/192000/audio gain 1/Resolution Compensation
Planning to use xrf mode after starting.
When press Icon,thermimo loads and reads immediately,
First reading almost invariably has spurious reading with peaks everywhere and
do not clear up giving wrong graph,
In other words the first 5 or 10 pulses are changing the graph significantly.
I dont know if xrf is based on limited no of events.
So to counter this,I press the start new measure and peaks are appropriately formed.
I shall send image later if so required
Thanks
Taray
If 5 or 10 pulses are so significative then your analisys is too short.
Wait more time and when the total pulses will be a normal 1000 pulses or more than the first 5 pulses will be completey insignificant.
In other words: The analisis to be significative must be long, so long that the analized pulses are a “great number”. This is because we are doing statistical analisis and only the “great numbers law” can produce significant results. A “great numer” is something like 1000 or more and compared to them, some initial pulse is nothing.
OR
If your entire analisis is normally long about 5 minutes then set the filter time to 5 minutes (300 seconds) and after this time the first 5 pulses will be automatically shifted out from the filter window and they will be, another time, completely insignificant.
This week we are making a new version of Theremino MCA and your suggestion is included.
We plan to discard the first pulses. Do you think that 10 or 20 pulses are enough?
10 is enough.
Thanks
Taray
Dear Sir (s),
Since a long time ago I have been very interested in measuring ionizing radiations of different kinds. A good radiation detector, a Scintillometer, has been to good use for me searching for rare minerals in pegmatites. Recently, I have found that gamma spectroscopy is an interesting technique to measure and characterize ionizing radiation. Some time ago I bought the Theremino PMT Adapter from your website and later a Scint Probe, a Bicron 1.12X1.12M3/1.12L. I’ve seen on your webpage how this probe was disserted and the resistors in the chain (originally 1 MOhm) were changed to higher values. My question is if you can recommend me a value of the chain resistors that will work well together with the Theremino Adaptor. Do I need to change other components besides the chain resistors (10 pcs.)
Thanks
Thomas
All this is explained in the MCA documentation, that can be downloaded from here:
https://www.theremino.com/downloads/radioactivity
Other useful info are here:
https://www.theremino.com/blog/gamma-spectrometry#socket
And here:
https://www.theremino.com/blog/gamma-spectrometry/hardware-tests
Suggestion:
You can use the english flag and translate the pages…
Hi Livio,
Theremino MCA loads and start reading automatically. Just wondering if it is appropriate to only load and not start immediately. Perhaps this may help in correcting some starting errors which may occur unnoticed which may be windows related and extra memory usage…
Well this just one of my thoughts and I am sure your engineers know better.
Thanks
Taray
Basing on your words, it could be that your input takes also the windows system sounds.
Please try to set the Theremino MCA “AudioIn” to exclude them, in order to get the audio input from the PmtAdapter only.
To disable the auto start could be disorienting for the new users.
bye Livio
A new version, with your suggestion (the RUN status remembered between successive runs) and some other little changes, is ready.
The new Version 6.8 is here:
https://www.theremino.com/downloads/radioactivity#mca
Thanks Livio.
I see some positive changes.
I will give it a review in due time.
Taray
Hi Livio,
I have a new feature suggestion : could you allow user to save preselections of activated isotopes ? For example a “radium” preset could activate Ra226 marker at 186 keV, Pb214 2at 242 keV, Pb214 at 295 Kev, Pb214 at 352 keV and Bi214 marker at 609 keV
This is really a good idea.
The problem is that we have to finish the SDR radio, the UpConverter, the Active Antenna, the Signal Decoder, the ADC24, the Dust Spectrometer, the Radar Doppler, the Theremino Balance, all the Webcam Apps not working with the formats NV12 and YuY2, as well as some other projects that I not rememeber now…
I say this because we are waiting some “expert” programmer to get some help. And maybe by reading this someone could write to us. (“expert” means more than 20 years of software programming, otherwise the right name is not “helper” but “help requester” and “time consumer”)
In the next days we will think if it is possible to implement this idea without changing too much the application structure. And, maybe, we will try to write it…
Thanks for your suggestion, it is really a new and useful feature.
Since this morning, we have tried to find a simple solution to implement your idea
and tried many methods to edit the single energies:
– separate single energies with “underscores” or with “spaces” or with “,”
– write a separate file for the isotopes energies
– do all by hand or automatically
Every new try has generated other and more difficult problems. So now (16:57) after about 8 hours of work, we decided to delete the new (instable) version and revert to the stable 6.9
sorry….
Maybe in the next days we will think another method, with a manually edited file, and completely indipendent from the isotope list editing.
Thank you Livio :)
BTW I am experiencing a very irritating bug in 6.8 version : I try to make a timed measurement, so I choose 5400 second in the time parameters and activate the “integr time” button, the analysis starts, but at some random before the 5400 second time the analysis starts again :( Have you heard of such erratic behavior ? I am using Windows 7.
Maybe there is a misundersatnding about the inegration time?
The “integration time” does not stops the analisys after the time selected.
The “Integration time” is the lenght of the integration filter.
If setting, for example, 60 seconds the analisys continues also after 60 seconds but the integration filter is short (only 60 seconds) and responds more to rapid variations.
The fast response produced by a short filter is at the expenses of a more noisy graph.
I do understand the integration time, and the feature worked well until today. What I mean is that I setup an integration time of 5400 seconds, starts the analysis, and at the 1556th second (for example) the total second counter goes back to 0 and the analysis starts again from scratch, without any action of my part. My Theremino version is 6.8.
There are only two functions in the application that could restart the total seconds to zero:
– Pressing “Start new measure”
– Pressing “Integr. time sec”
In the last versions nothing is changed in this area.
Now we are testing the last version (6.9) with 5400 seconds and “Integr time enabled” since may hours and Total Seconds is always stable at 5400 seconds…
We will do further tests.
We have found a possibility.
When the “auto” pulse polarity changes then there is an automatic restart.
Please select manually the pulse direction (positive or negative) for your audio card.
And then, please, test if the problem is corrected.
If it is, then your pulses are strange, so strange that the auto polarity detector has been fooled for some consecutive seconds.
Or you have disconnected the BNC for a long time.
Or the windows mixer has changed.
Or you are reading the audio from the mixer output called “stereo mixer” and some other sound, maybe the mouse sounds, have been mixed with the pulses.
We are doing other tests…
And we are implementing your idea for the sample rows.
It may be well related to audio, and perhaps my Theremino installation is corrupt because the 6.8 version doesn’t seem to show sufficient audio volume for detection anymore, even if the parameters are the same than the 6.7 version that I also have on my computer. I am going to install the 6.9 version, in a third folder.
What is a good way to keep the same calibration from a version to another ?
(and thank you for your time Livio, it is appreciated)
You could “save” a configuration and “load” it with another application.
Or you could copy the file “Theremino_MCA_INI” to the new application folder.
But there are not invisible “calibrations”, all is visible in the main window. And nothing has changed in the last versions that could change the audio sensitivity.
Maybe the Windows Mixer volume or the AGC are changed?
They can change, every time you disconnect the audio card, or change the USB port.
Did some testing yesterday, I put the pulse setting on “negative” and it worked fine, without restarts. That is strange since I always used “auto”.
Nothing changed in my audio settings as far as I know. Volume is the same and there is no AGC.
OK, thanks.
Today we will publish the new version 7.0 with many improvements:
– Your suggestion implemented (the sample to rows list).
– Removed the restart when changing pulse direction.
– Removed the restart when selecting and deselecting the “Integr. time” button.
– A new “Audio input” selector with strings instead of numbers.
Theremino MCA Version 7.0 is ready, with your suggestion implemented, and many other improvements:
https://www.theremino.com/downloads/radioactivity#mca
Hi Livio,
Just to say that I LOVE the 7.0 version, rapid selection of nucleides is a must, and the addition of the audio input name is great too.
I have another suggestion of feature : have you ever thought to provide a second view of the counts vs time, like in PRA ? This would allow the study of decay of short lived radioelements, and the variations of ambiant radioactivity over time.
Also is there a way to “route” Theremino MCA signal to Theremino Geiger, to use a scintillation detector as a geiger counter ?
First question
Sorry but this would involve too much changes to the application structure and too much work.
Second question
Yes,
1) Set “Counter slot” with a number between 0 and 999.
2) Set the same number in the Theremino Geiger Input-Slot.
This is also explained in the instructions at page 23.
And with Theremino Geiger you can see the counts vs time, as with PRA and even better.
Thanks again Livio, it did the trick :)
————————————————————————-
DUBBI SULLA SOUND CARD ESTERNA
————————————————————————-
Su radioactivityforum c’è un thread intitolato “Dubbi Theremino Sound Card”
http://www.radioactivityforum.it/forum/viewtopic.php?f=22&t=1526
Abbiamo letto casualmente quel forum quindi in caso di problemi
è consigliabile scrivere a engineering@theremino.com.
E se disponete di un fisso, possiamo richiamare per tutto il tempo necessario,
a costo zero, dalle 09 alle 19, anche festivi.
Nei casi peggiori abbiamo dovuto usare TeamViewer e intervenire di persona
e i difetti si sono sempre rivelati come errori o incomprensioni.
Abbiamo provato a rispondere nel forum, ma il messaggio di risposta non è apparso,
quindi rispondiamo qui:
—————————–
RISPOSTA
—————————–
Riguardo al 192 KHz evitiamo di aprire una polemica sul campionato e sull’interpolato
quindi, per piacere, parliamo solo di risultati.
E i risultati sono:
– Se si impostano 44.1 KHz lo FWHM aumenta
– Se si impostano 192 KHZ lo FWHM si riduce
Ricordo anche che nel nostro progetto la scheda audio contiene un filtro passa alto,
il quale riduce notevolmente il rumore alle frequenze che non interessano
e contiene anche una modifica, per dare la alimentazione sullo stesso cavo del segnale.
Le schede audio interne difficilmente sono modificabili in questo modo
per cui non hanno il filtro e il percorso della alimentazione segue necessariamente
una strada separata.
Con una scheda non modificata, e quindi con alimentazione separata del PmtAdapter,
si crea inevitabilmente un loop di masse, che impedisce di scendere con il rumore,
ai livelli incredibilmente bassi che abbiamo ottenuto con le nostre modifiche.
Seguendo con precisione il nostro progetto, si ottengono risultati che nessuna scheda interna
e nessun apparecchio hardware possono ottenere (FWHM del Cesio che sfiora il 4%)
Se qualcuno non riesce a ottenere questi risultati, sta sbagliando qualcosa
e farebbe bene a scriverci.
Is there a way to define a peak (e.g. drag the cursor across the peak to mark the low and high channels/keV) that will display the gross and background counts so the net counts can be calculated? I did a search on the site and couldn’t find anything, but I am very new to this MCA.
Thank you in advance,
Barry
Hi Barry,
For us it is difficult to explain this in english, so we write in Italian and provide an automatic translation.
ITALIAN
Sappiamo che altri programmi usano il concetto la ROI (regione di interesse). Cioè contare tutti gli impulsi che si trovano tra due markers arbitrari. Sarebbe molto facile implementare questa funzione, ma preferiamo non farlo, per non generare false illusioni di poter misurare quantità, che in realtà non sono misurabili. Qui di seguito una breve spiegazione:
Nell’area tra i due marker ci sono solo impulsi dovuti all’isotopo che si vuole misurare?
Sicuramente no.
Ci sono impulsi che sono parte del fondo ambiente.
Ci sono impulsi che sono scattering di altri isotopi.
Ci sono impulsi che sono parte della gaussiana degli isotopi adiacenti.
Ci sono impulsi dovuti ad errori di selezione del BIN.
E ci sono impulsi causati dal rumore.
Quale percentuale di impulsi è prodotta dall’isotopo che si vorrebbe misurare rispetto a tutto il resto? Impossibile saperlo. Quindi daremmo la falsa illusione di poter misurare qualcosa che non è misurabile.
Ottenere dei numeri
E’ facile dare numeri a caso ma a noi non piace ingannare gli utenti. Se proprio si vuole ottenere un numero allora in Theremino MCA si deve usare la super deconvoluzione, impostare l’isotopo (o gli isotopi) di cui si desidera la misura, e leggere i risultati “quantitativi” per l’isotopo (o gli isotopi) di interesse.
Detti valori sono anche inviati agli Slot e quindi disponibili per ulteriori elaborazioni.
La super deconvoluzione fa un calcolo a matrice sulla gaussiana centrata sugli isotopi quindi il risultato è migliore che semplicemente ammucchiare tutti gli impulsi che vanno da “qui” a “li”.
Ma anche la super-deconvoluzione si basa su assunti non quantificabili e produce numeri validi solo se l’influsso degli isotopi non considerati è zero e se la larghezza della gaussiana che si imposta è esattamente uguale alla larghezza reale (FWHM) degli isotopi da misurare.
ENGLISH (automatic translation with some correction)
We know that other applications use the concept the ROI (region of interest). That is to count all the impulses which lie between two arbitrary markers. It would be very easy to implement this feature, but we prefer not to, so as not to create false illusions of being able to measure quantities, which are not really measurable. Below is a brief explanation:
In the area between the two markers there are only pulses due isotope to be measured?
Surely not.
There are pulses that are part of the background environment.
There are pulses that are scattering of other isotopes.
There are pulses that are part of the Gaussian of the adjacent isotopes.
There are pulses due to the BIN selection errors.
And there are pulses caused by noise.
What percentage of pulses is produced by the isotope that you would want to measure, compared to everything else? Impossible to know. So we would give the false illusion of being able to measure something that is not measurable.
Getting the numbers
It ‘easy to give random numbers, but we do not like trick users. If you really want to get a number in Theremino MCA then you must use the “Super deconvolution”, set the isotope (or isotopes) of which you want to measure, and read the “quantitative” results for the isotope (or isotopes) of interest.
These values are also sent to the Theremino Slots and then available for further processing.
The super deconvolution makes a matrix calculation on Gaussian centered on isotopes then the result is better than simply piling all pulses ranging from “here” to “there.”
But even the super-deconvolution is based on assumptions which can not be quantified and produces valid numbers only if the influence of the “not considered” isotopes is zero, and if the width of the Gaussian that you set, is exactly equal to the real width (FWHM) of the isotopes to be measured.
Hello Livio,
Thank you for the interesting response, I agree with what you’ve written about sources of error and have to think about that for a while. E.g. it seems that if I have a discrete peak associated with Bi-214 at 609 keV, I should have pretty good confidence that the peak is real, and understanding the error associated with the measurement, should be able to quantify the net counts (again, agreeing that there is a fair bit of error in that number).
Thanks for explaining Super-Deconvolution and its assumptions and limits. I think I’ll run several counts of the same source, using identical sys parameters and count times and compare the net counts for some ROIs from the different counts to quantify the variability in the net counts.
Also, thank you, and any other people involved with this software and site, for putting so much time into this project that allows me to play with a gamma spec system in my own home – very much appreciated!
Cheers,
Barry