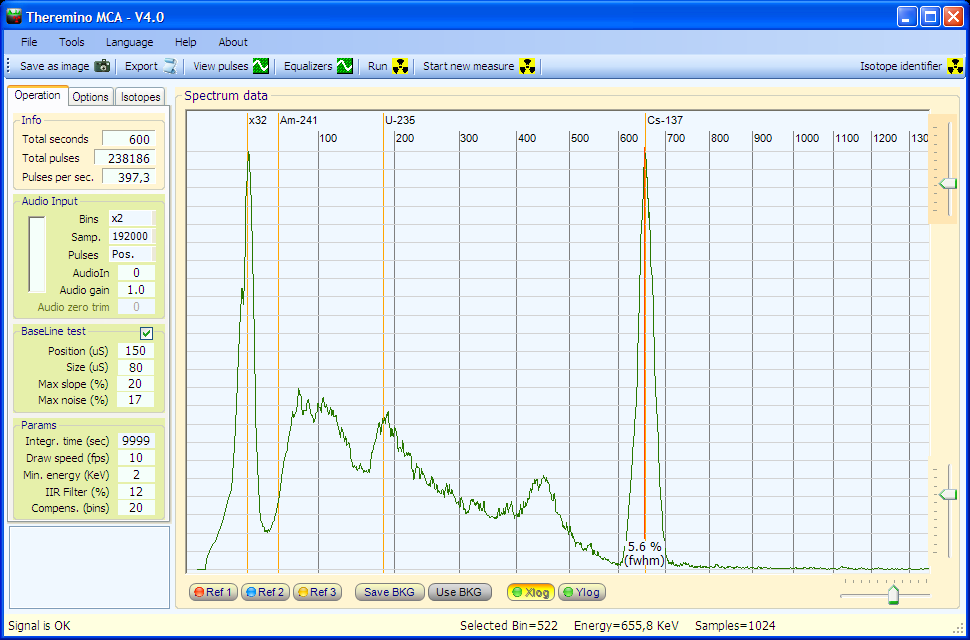
The signatures of the most common radioactive samples
Excellent images prepared by Paul (HappyNewGeiger). Click the images to enlarge them.
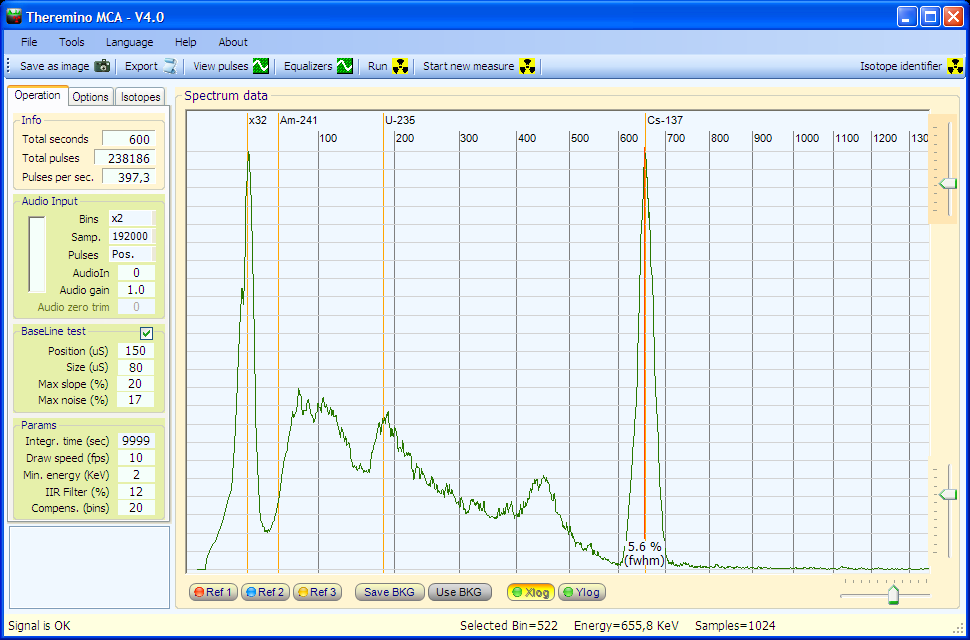
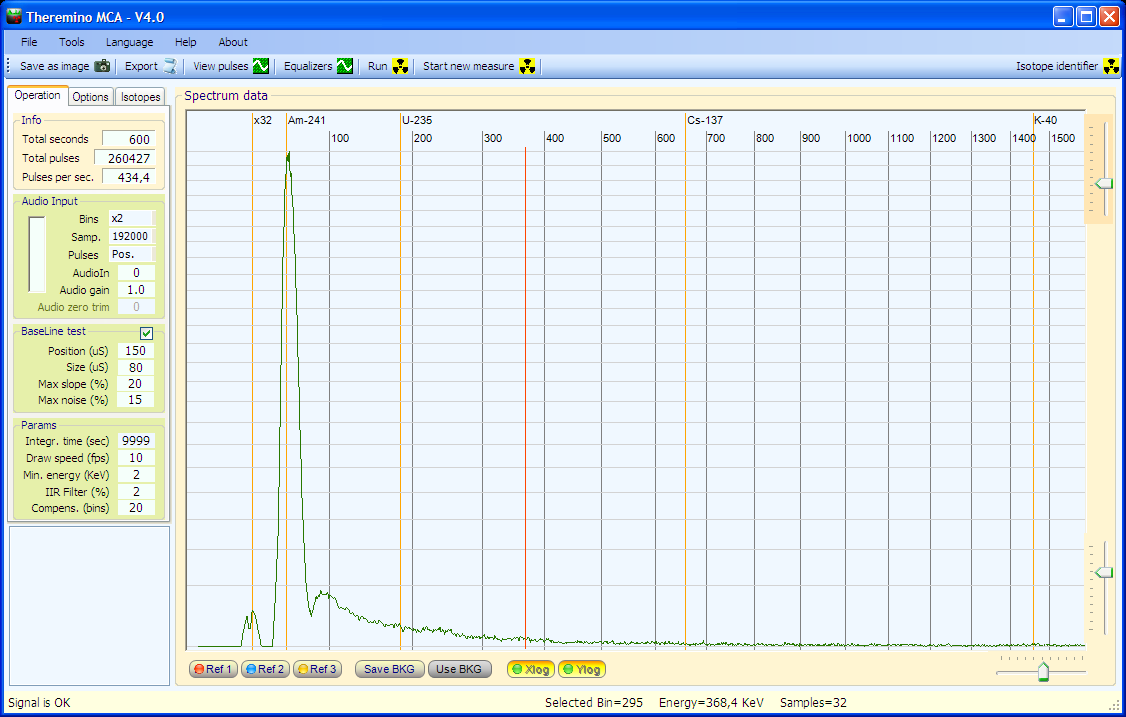
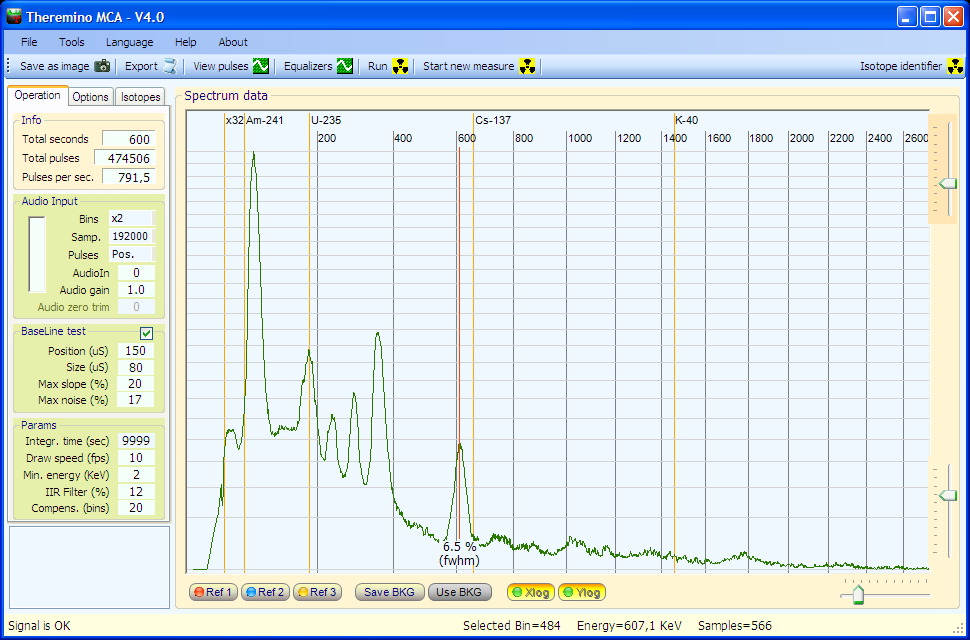

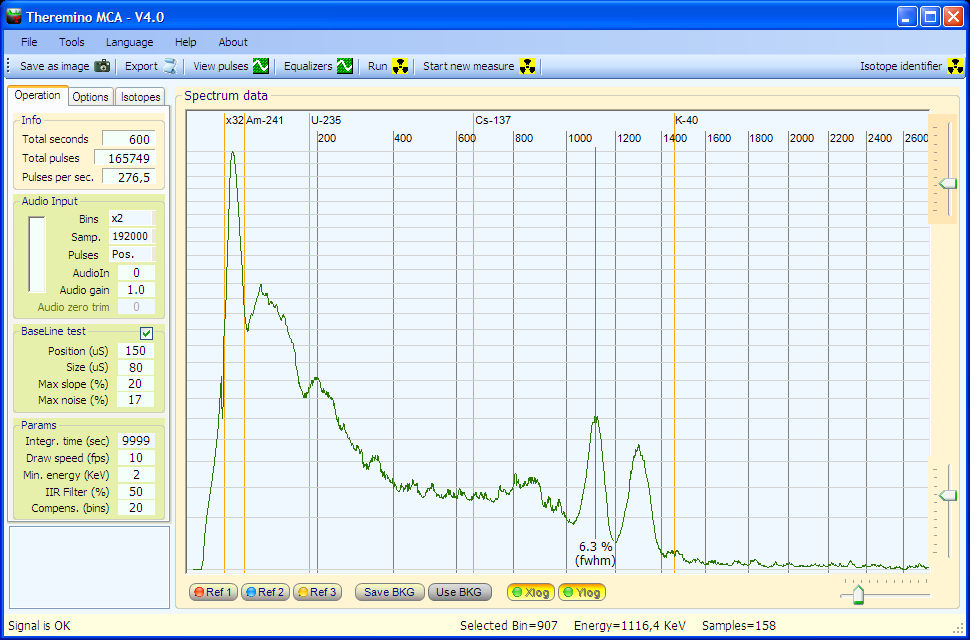
Caesium (CS-137) Americium (Am-241) Radio (RA-226) Thorium (Th-232) Cobalt (Co-60)
- Caesium (CS-137) – Provides two lines very comfortable to calibrate. It is found in “Spark gap” CK1097-7 and CK1097-12;
- Americium (Am-241) – Easy to find in the “Ionization smoke detector”;
- Radio (RA-226) – Easy to find in the dials and hands of old clocks;
- Thorium (Th-232) – Easy to find in the mantles of gas lamps for camping “Thorium mantle”;
- Cobalt (Co-60) – NET provides two lines well but it's hard to get it.
Beautiful spectrum posted by Vital1
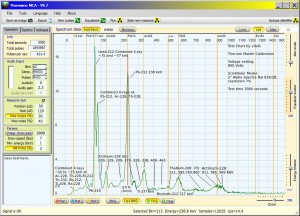
The sample was a mantle, Camping lamps, containing Thorium (Th-232). The graphic quality is outstanding, the adjustments are great, the lines well defined and well commented.
Mantles “Thorium Gas Mantle” are dangerous because they can lose fragments. Should be handled with care not to eat or inhale the pieces of wire that come off. Better left closed in original bag or in a good thick nylon bag, well sealed. But this is nothing compared to the use to which it was camping. Charred gas mantles became lightweight powder that flew through the air and changing it up (in tents and in the dark) It was definitely a good deal. And at the bottom, after dozens of years, We're all still here… so don't go overboard with the alarmism.
Two interesting and useful test, posted by Nicola.
Soil collected in Fukushima On bottom (BKG) LYSO Crystal
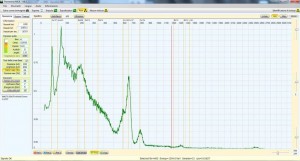
The first is the spectrum of a few grams of soil collected in Fukushima. You can see the line of Caesium 137. While the two lines of Caesium 134 are lower, due to the short decay time.
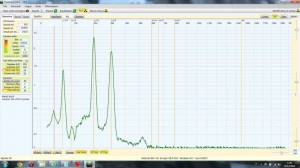
The second is the bottom that you get using LYSO Crystal, that are cheap but slightly radioactive. The LYSO contain well defined about two lines producing Lutetium 200 and 300 Kev.
Miscellaneous images
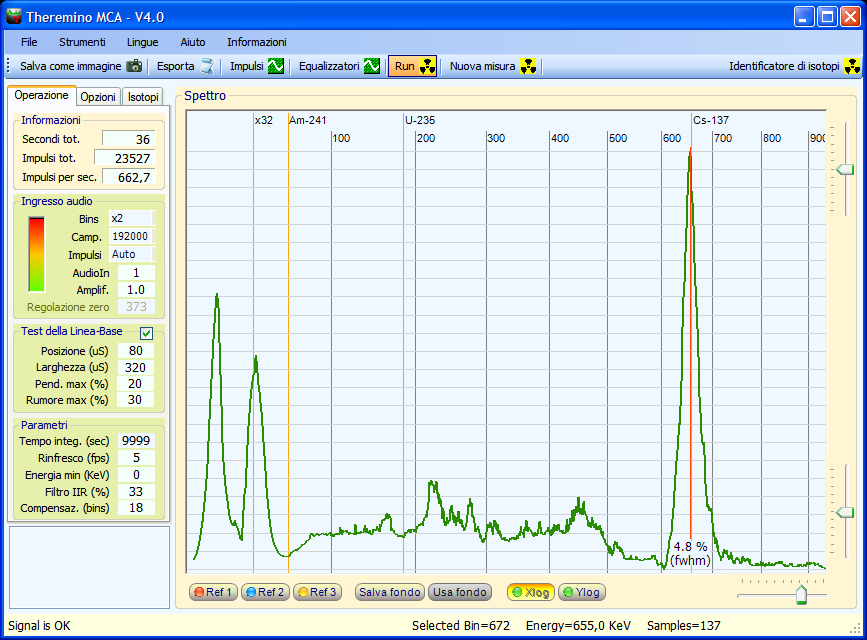
Crystal resolution compensation get off the FWHM of at least one percentage point. With normal NaI(TL) You can easily reach toward the 5% and even less, with BGO under the 10%.
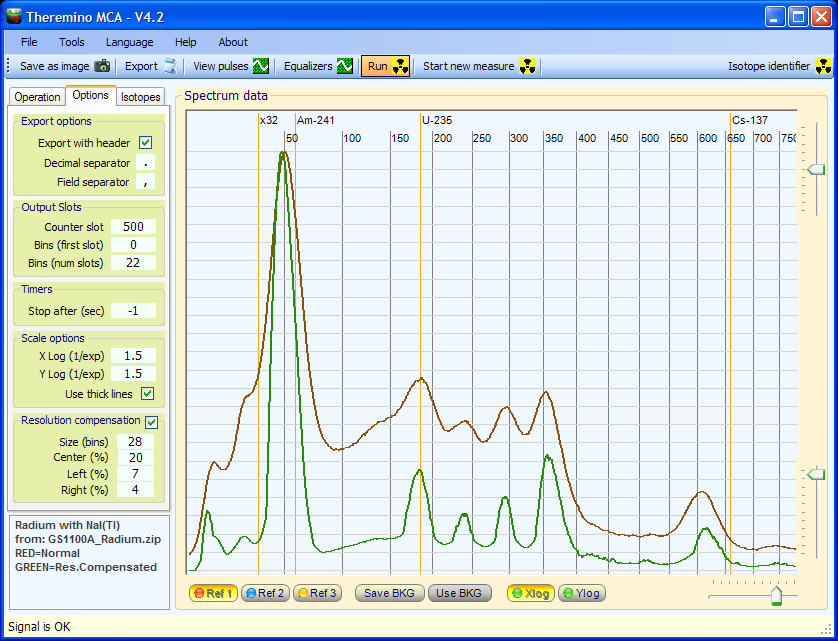
The Radio without compensation (Red) and with compensation of the resolution of the Crystal (Green)
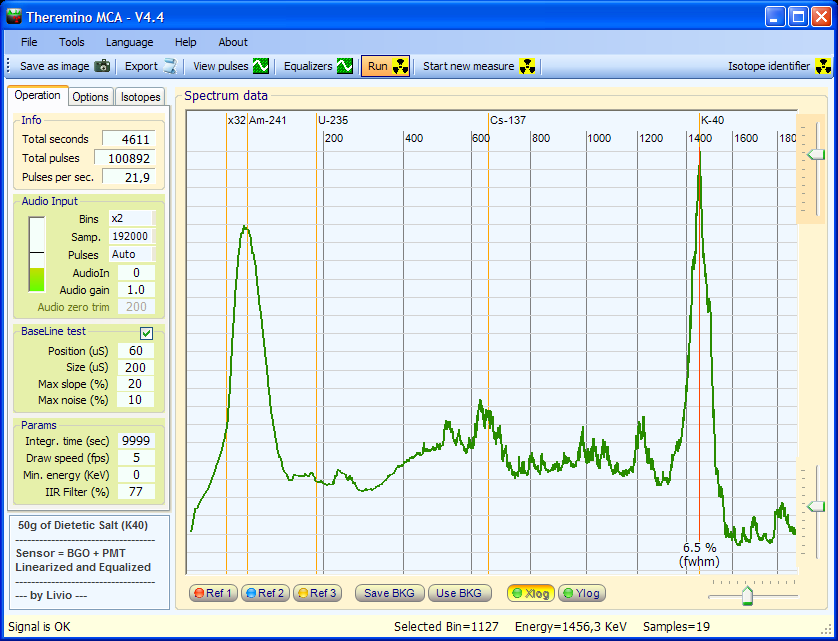
A bag from 50 grams of Dietary Salt, containing Potassium (K40)
This is not the usual and easy, Caesium. To get a line of potassium so sharp it took over 60 minutes. You can see clearly even americium and cesium, present in the laboratory, two meters away from the probe. Note also that the Crystal is a simple BGO, very small and inexpensive.
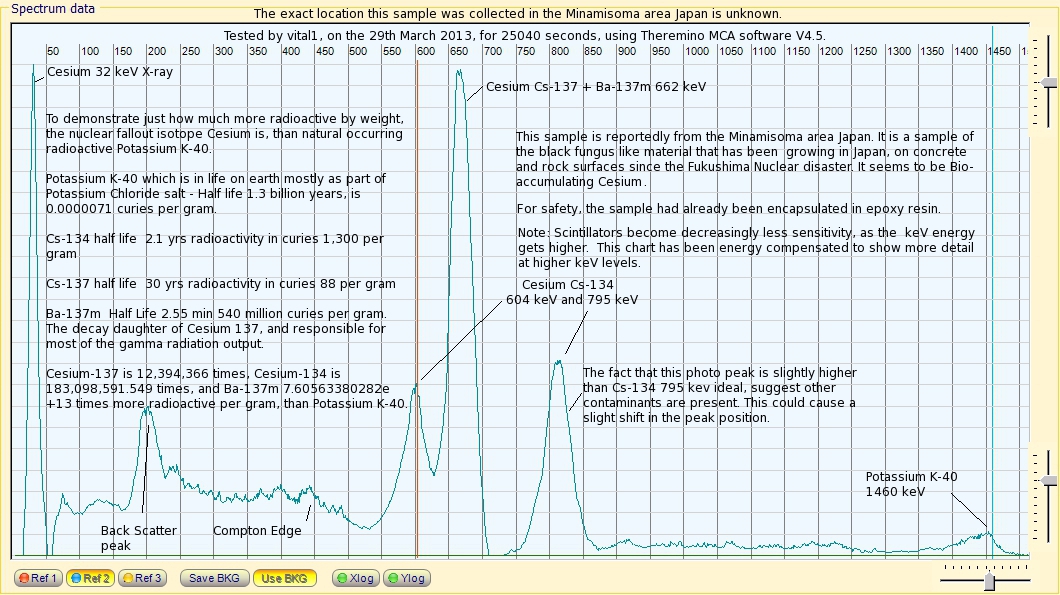 Beautiful spectrum of a Japanese mushroom.
For further explanation see here: blogs/gamma-spectrometry # comment-2105
– – – – – – – – –
Send your pictures to: livio@fastvr.com will help to develop the ThereminoMCA and make it work better on your hardware.
The images must also contain the left adjusted with data that you consider important and should also contain a brief explanation in the lower left pane.
DON'T TAKE PICTURES IN FULL SCREEN !!!
Reduce the ThereminoMCA about 800 pixels wide (smallest possible or almost) before pressing the “Save as Image”. If you do not do this we will not be able to publish them because when put in the Blog, that is about 800 pixels, would become shoddy and unreadable.
Try not to use full-screen ThereminoMCA, It is not made to work so, consume unnecessarily much CPU time and even the entire desktop (the fan is double trouble, blowing and bother switching capacitors and fry them for warmth) And finally, you won't see better, but worse because’ useful information and the writing become tiny and lost in a huge space, desert, that says “I have the background of the chart. they are cute and sometimes I even and uniform blue some nice grey stripe detail…”
Images of Caesium with probe RAP47
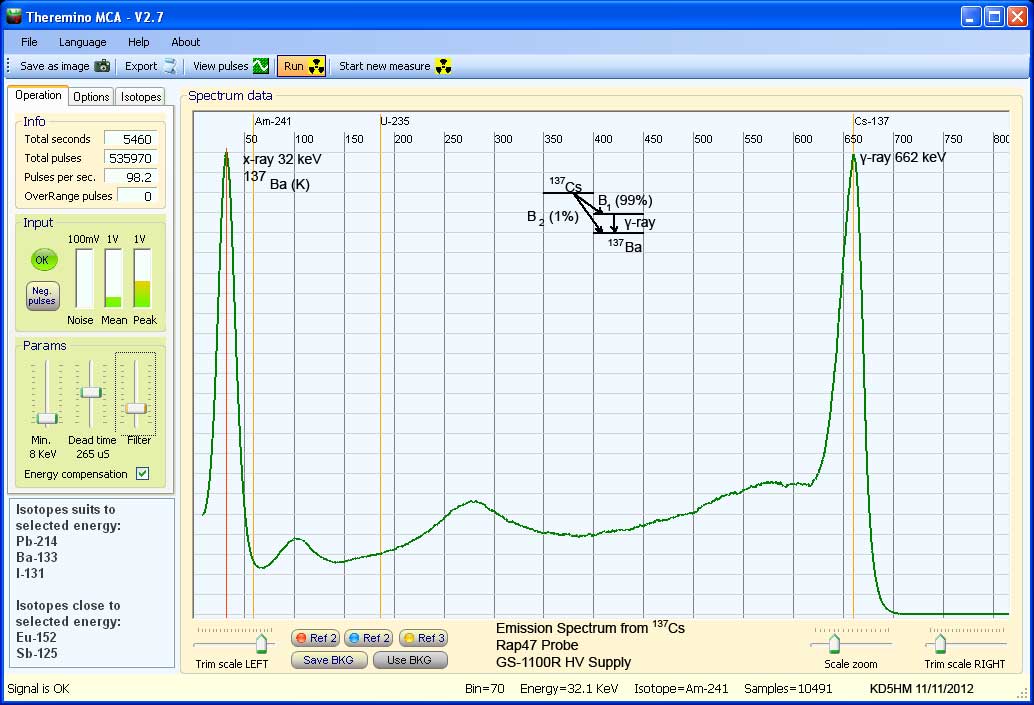 Initial Cs137 Spectrum using Theremino with a RAP47 Probe. Theremino software made the process for obtaining this spectrum very easy. Thank you to all who have contributed to this excellent software! Best regards, – Tom – KD5HM – Watauga Skies Observatory – www.wataugaskies.net
Setup: Rap47 Probe / GS-1100 HV supply and signal interface / E-MU USB Audio Interface at 192 kHz sample rate / 1-1/2″ lead shield / Photoshop CS / Sampling period: 91 minutes.
XRF Imaging
Many researchers are active in research XRF (X Ray fluorescence) and there are already guidelines to build simple and effective XRF sensors.
Tips for minimizing the noise PmtAdapter
http://pico.dreamhosters.com/ThereminoPmtAdapter.html
The most interesting links:
http://pico.dreamhosters.com/ThereminoMcaSpectrums.html
http://pico.dreamhosters.com/XrfSpectrums.html
http://pico.dreamhosters.com/XrfSpectrumsPartTwo.html
http://pico.dreamhosters.com/XrfFluteSpectrums.html
Images on BaseLine restoring
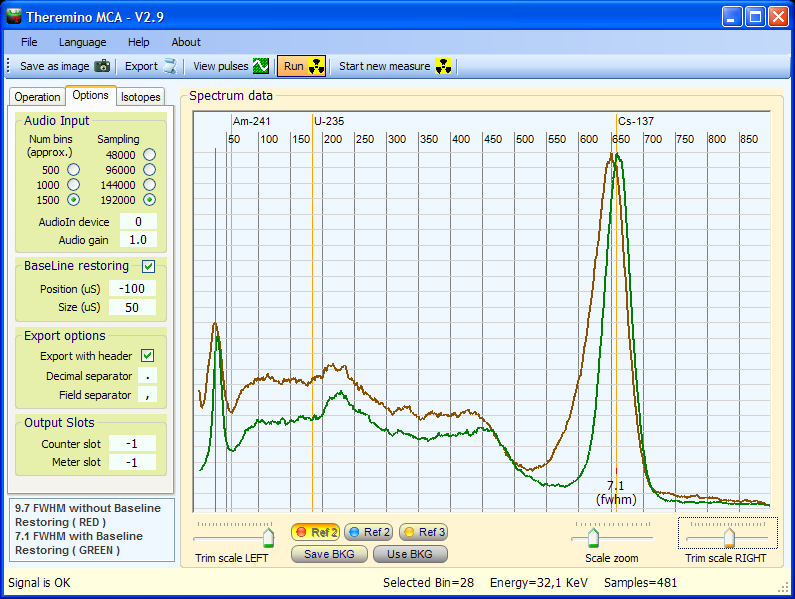 This picture shows what she can do on BaseLineRestoring. The noise drops of 30 % and the FWHM passes from 9.7 % at 7.1 %
The BaseLineRestoring must be adapted to the characteristics of its signal. If you do not set good parameters ThereminoMCA works equally well but the lines are widening a bit. Even adjusting the DeadTime affects, both must be set appropriately depending on the width of the pulses.
From version 2.11 on the box “Position” Restoring the Baseline is adjusted differently. Before specifying the distance, negative, from the center of the impulse to the left side of the sampling zone. Now, however, specifies the distance from the right side of the sampling area at the center of’ impulse.
No change in performance, you just have to get used, who wrote -100 (negative) now he must write 50 (positive) and who wrote -150 (negative) now he must write 100 (positive)
If you have doubts you put the value 50 both in “Position” that in “Size”
Benefits of this change:
– We only use positive numbers, easier to understand and remember
– the sampling area can only be moved in the eligible zones and do not make mistakes.
Little explanation on the operation of BaseLineRestoring
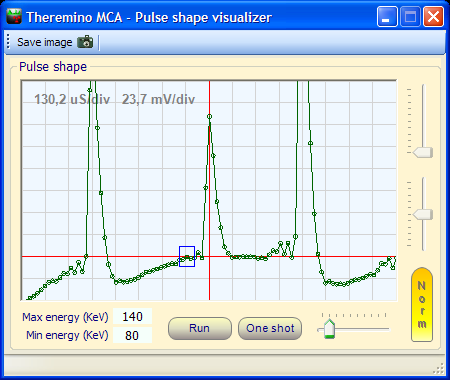
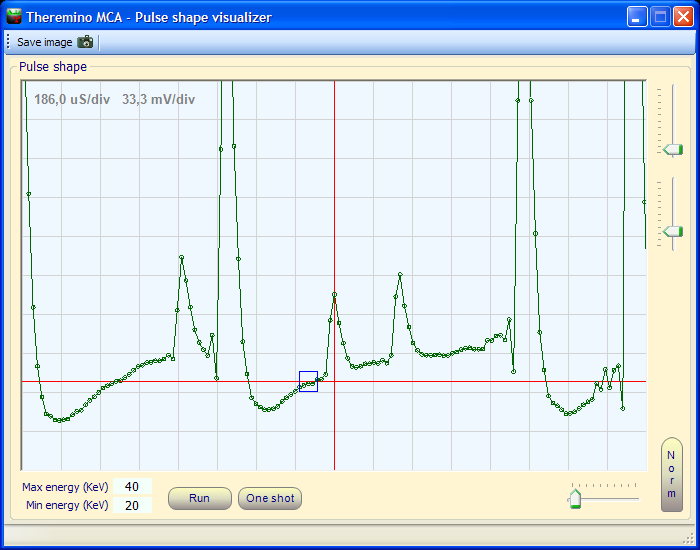
The blue rectangle bounding the area where the algorithm looks at to determine the height of the ZERO. This rectangle can be moved right and left, enlarged or shrunken.
Depending on the length of the pulses produced by a particular hardware, their ringing, sampling frequency and noise, the best place for these regulations can vary.
Across the width of the rectangle algorithm averages of tensions and ultimately determines which is the more likely that the zero line had instantly set half of the rectangle. Zero serves then to establish the pulse height (height = maximum – zero) Each pulse has one zero differs because the baseline moves continuously (If we had signals “Professional” This would not happen) The maximum of each pulse is easily seen but zero in many cases is difficult to establish.
The best place where to measure zero is just before the impulse but:
If we measure too far left then before it reaches the zero pulse changes and measure with little accuracy.
If we measure too close to the start of the impulse there is the “ringing” and we measure with little accuracy.
If you measure for a long time you take an average too far by pulse and measure with little accuracy.
If you measure for a short time the average vienbe done on few samples and measure with little accuracy.
Just go wrong very little height of zero that the pulses are measured too low or too high, mistaking the 10% It means, More or less, enlarge the pulses of 10%
And’ difficult to explain this with the words, look at the images below and try to locate where is the base of each pulse so you can calculate with precision the height. Mind you err in measuring the height of even very little can enlarge greatly the rows.
The following images show common situations of overlapping pulses and sinking of the zero line (Pulse-PileUp and BaseLineShifting- Pileup) that can prevent accurate recognition of pulse height and then widen the rows.
The blue rectangle indicates the reference zone used by the algorithm to “Baseline Restoring” to decide where is the zero of this impulse. Note that once you locate the zero pulse is moved up or down in order to match the zero level graphically with the horizontal red line.
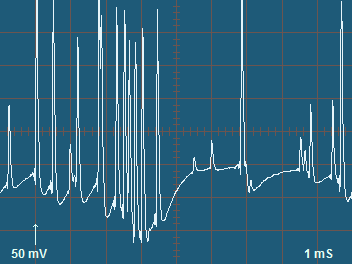
This image shows a moment of strong crowding of impulses, the zero line has moved a lot and it's really hard to recognize his position before every impulse because at some points there is no space between an impulse and the other.
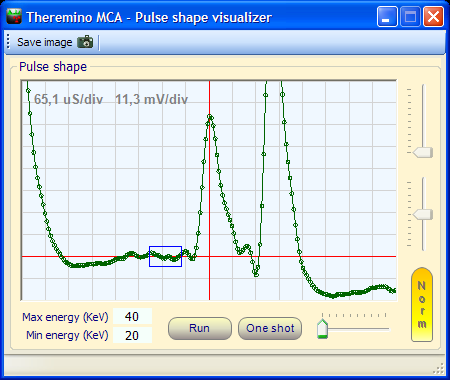
In this picture there is no pause before the next impulse that won't be’ can locate his zero with precision.
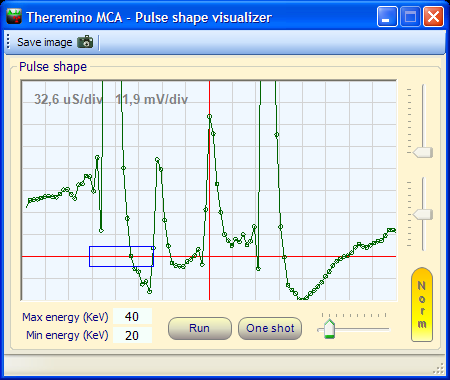
Here there was a measurement error serious enough.
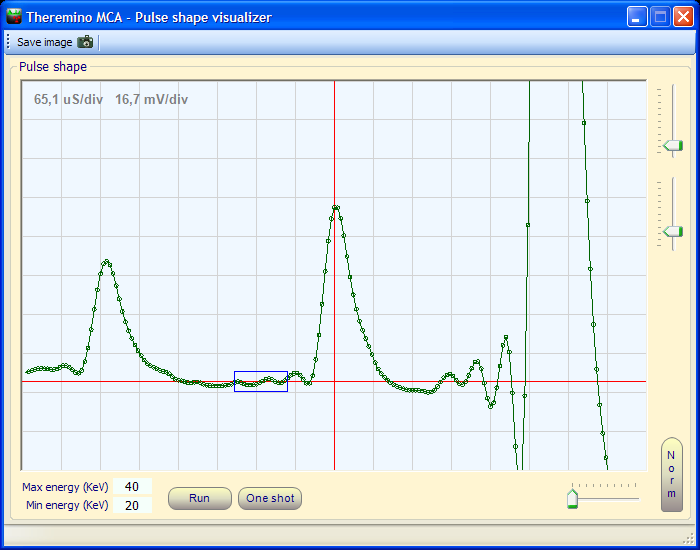
This impulse is aligned with the zero very well but notice how big the ringing in proportion to the height of impulses. The ringing makes it difficult to identify precisely where is the zero line.
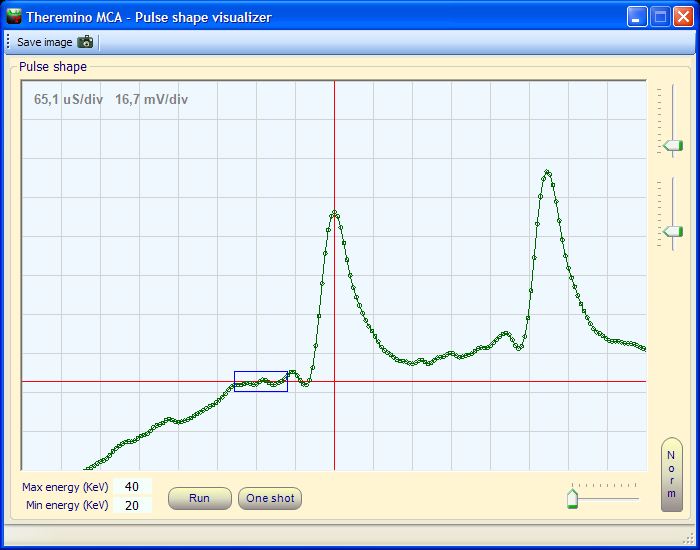
The zero line salt very quickly in this area for which having measured zero before zero value measured is low pulse width and height of the impulse is overestimated. We tried to measure before and after it has not’ possible because some signals contain a “Undershoot” very strong that false completely the area that follows the impulse.
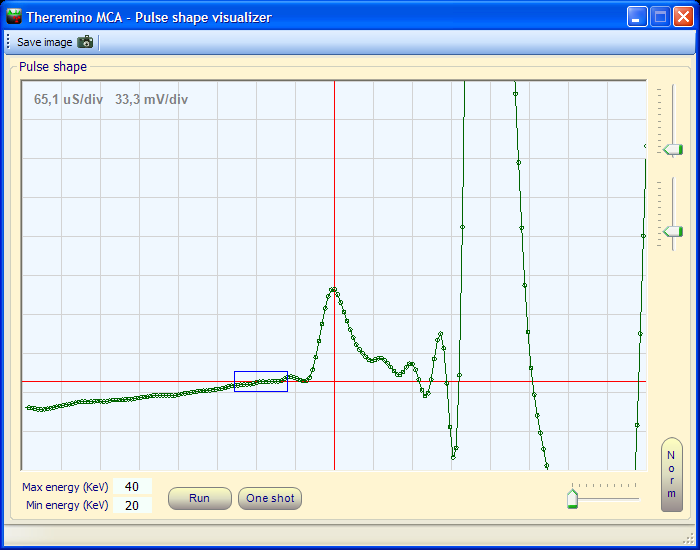
Depending on the’ moment of rising some impulses may have little or much ringing.
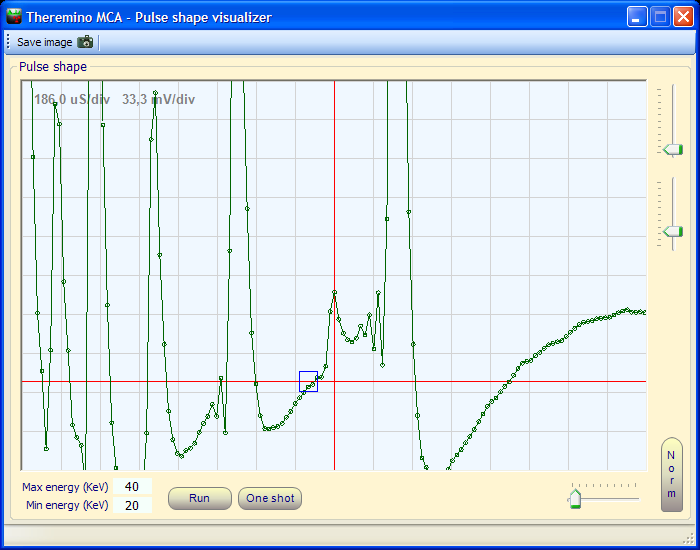
A much needed boost overestimated.
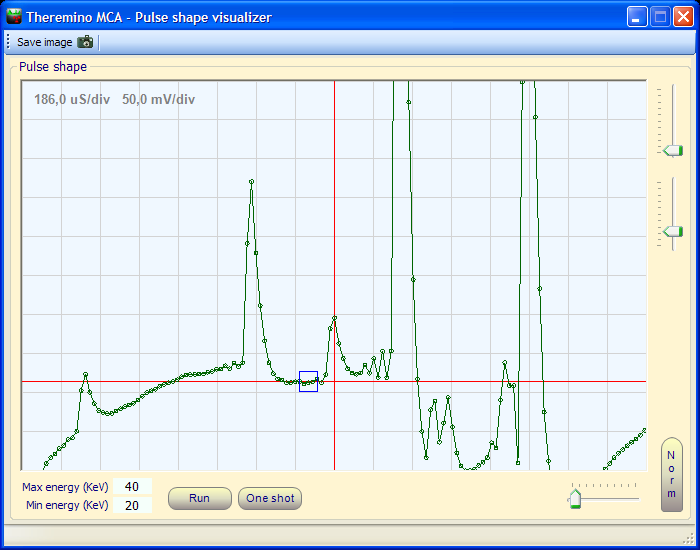
A pulse slightly overestimated.
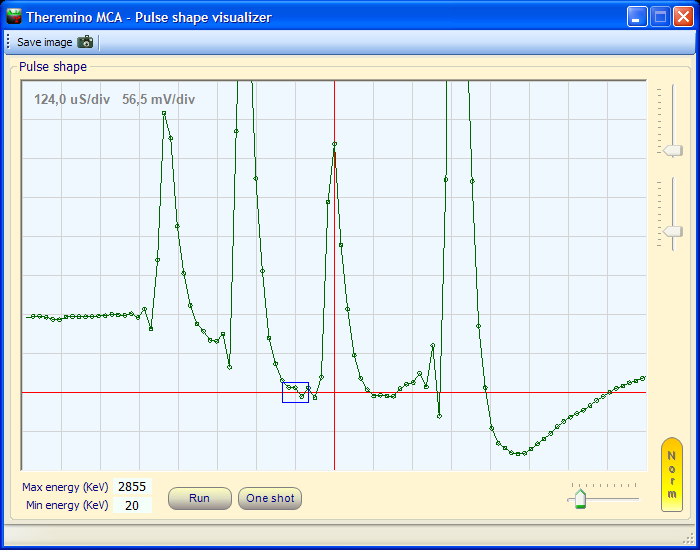
And finally a pulse measured almost perfectly. Note that this “almost” is already a failure of 2 or 3 percent (Notice the green line after the pulse a bit’ low)
It seems incredible to have a modicum of accuracy with signals so ugly. But fortunately the glitches are a few percentage. To further decrease the percentage of glitches avoid overcrowding! If the sample is too radioactive, drive a little’ (at least enough to measure less than 200 pulses per second). With less common pulses it takes longer but the noise subsides and the lines shake.
Line width – FWHM
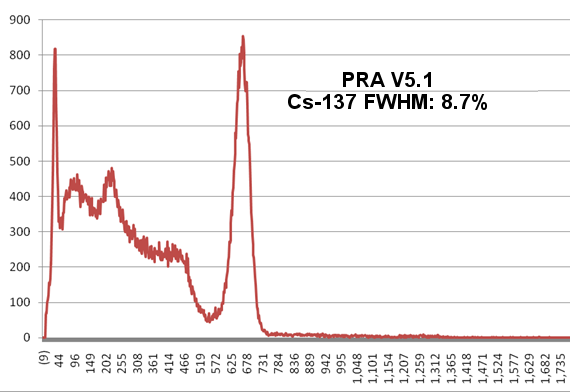
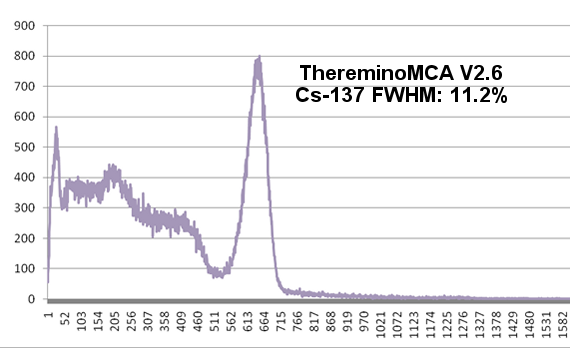
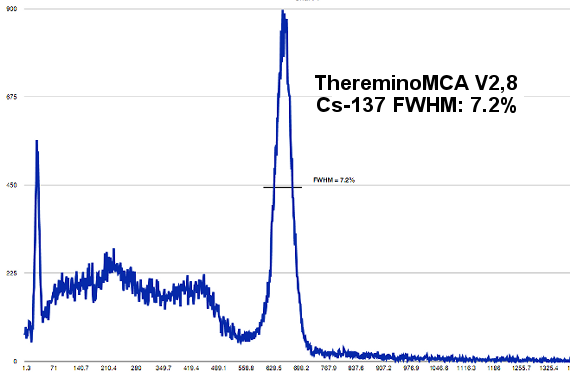
Up to versions 2.6 and 2.7 the FWHM of ThereminoMCA was slightly lower than that of PRA 5, but the version 2.8 She passed the PRA di 1.5 points.
We arrived in 7.2% but there's still room for improvement. Now, it is necessary for ThereminoMCA shows himself in line width FWHM, so that you can check immediately the effect of our trials. So we stopped the other research and we are preparing the FWHM.
Theremino MCA V4 – Overcome the barrier of 6%
Measuring after the filter is not possible “cheating” and measure low levels caused by sharp/sharp and frastagliamenti. You can lift the filter and see if the FWHM “Regge” It doesn't rise too. (of course the same filter enlarges a little’ and this is normal)
Comments
Of course you can leave comments, questions and advice.

