An example of environmental monitoring

Environmental Technical Institute radioactivity monitor Galileo Ferraris in Empoli.

We chose an image of 3 February 2013 showing an event of heavy rain. The graph starts at 11 of the day 2 February 2013, the notches at the bottom are one hour each and the date refers to the end of the chart, to the right.
It rained lightly from 12 at 18, strong from 18 at 21. The graph shows a maximum at 21-22 by ben 145 NS/h, then the measure back quickly to the Environment Fund “normal” (from 80 to 95 NS/h). Since you have used an integration time of two hours, the chart presents data delayed by about an hour and rise and fall times of almost two hours.

This chart shows the mm of rainfall in the same period of time.
– – – – – – – –
Other significant episodes

The rain of 25 February 2013 coming up to about 170 NS/h
Measuring radon
Information about the room at ions for radon in this page:
www.theremino.com/hardware/inputs/radioactivity-sensors
Experimental station of Alessio (not always online)


 http://www.meteolink.it/radon.html
 http://www.meteolink.it/enradon.html
Environmental monitoring station of Gummy Luciano
For years Luciano is one of the most assiduous experimenters system Theremino. He made everything and really helped us in testing. The idea of the sensors for the electric and magnetic fields was his. Contributed to the trials of the FESN, building the station of Castiglione Vara, for Beta and Gamma radiation and ion Chamber for Radon (pages 40 and 41 by This document).


Luciano station is very complex, includes eight sensors, a solar Tracker, two slave modules, sensors for Lightning and electromagnetic fields and finally a Masters, that in the latest versions is situated at the end of a serial line, long 35 meters.
Everything is logged to file from ThereminoLogger_V5 (available examples of Theremino Script). The Logger (from version 1 the 5) It was written with the contribution and according to Luciano trials.


Amazingly everything keeps running! And it's not easy because the Sun raises the temperature, sometimes even 80 degrees and more. And when there is no Sun, Here come the humidity, the cold and condensation. They are very well made cables.
Graphs of 2015
The station was active throughout the 2015 and produced accurate and meaningful charts.
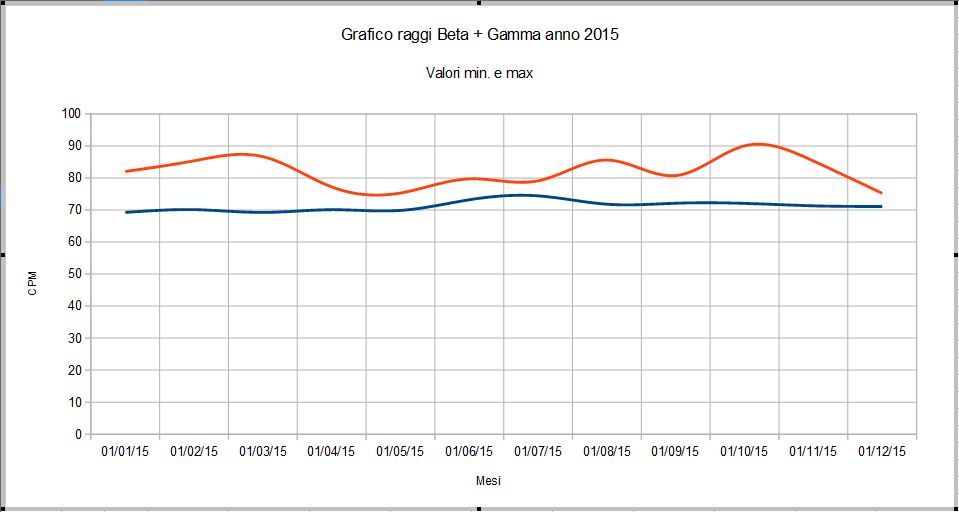
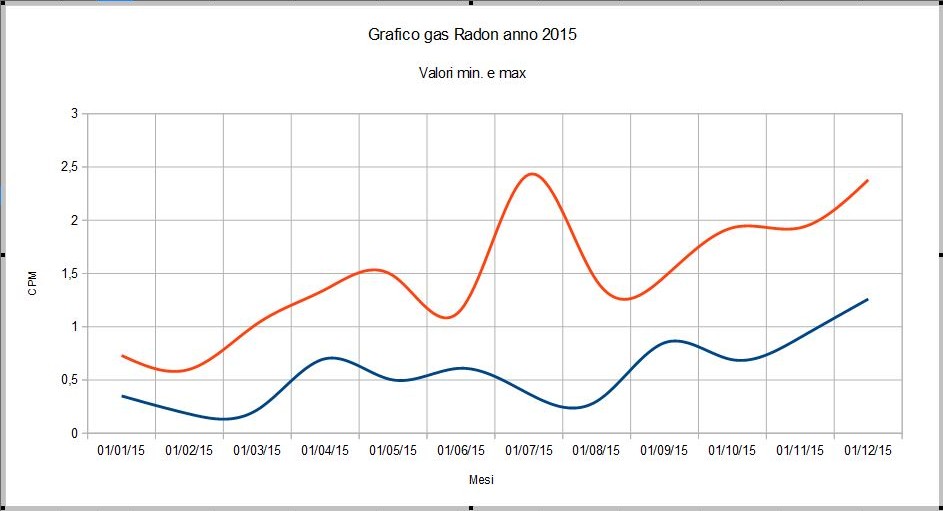
The two charts show that Beta and Gamma basically never change (less of a future nuclear war). Instead the Radon has strong variations, You assume related to ground movements. This chart confirms that Radon can be useful as an indicator, for earthquake prediction (see the iAReSP research).
An experimental station for radon and an information-rich site


The site www.iw5amb.it is a super concentrated information on meteorology. The good organization of the site makes it easy to consult information of all kinds: from geology to earthquakes, to the webcams, the radioactivity in the environment but also curiosities, information and news. And now the tests on the ion Chamber for radon.
A gauge of radioactive contamination of food
 Geiger Dares 14 – Marble Carrara – Frediani


Paolo Fernandes dell’ Apuan Seismic Observatory Geiger has developed a perfect for your kitchen. The sensitivity of this device is to identify dangerous contaminations in minutes and the minimum in seconds. The appliance can be cleaned easily and presents the results on a tablet. The tablet can also be used for recipes and other kitchen appliances based on Theremino, as the tester for the extra virgin olive oil and programmable thermostats from software.
Environmental monitoring stations
The bully back to nuclear professed by politicians globally, could lead to greater risks in the future. Today's technology allows us to organize an extensive network and is independent of the official networks and then sleep relaxed.

The seismic Observatory Apuano triggered environmental monitoring, with graphs of three stations: http://www.osservatorioapuano.org/radioattiv.asp
To organize monitoring networks, write a message to Paul Frediani, in this very blog.


Seismic networks FESN (www.fesn.org) and IESN (www.iesn.it) conduct research on seismic precursors and on environmental radioactivity, as well as a continuous seismic monitoring. Their publications are always very interesting and well maintained. A pleasure to read them.
Here is the report of the Meeting 2014:
https://www.theremino.com/files/Meeting_FESN_IESN_2014.pdf (*)
(*) This is the same PDF file you download from the portal FESN. We linked in HTTP because were difficult to access with an FTP client

Theremino the system is working with the Association iAReSP, within the project Tellus, for the study of Radon as seismic precursor.
The iAReSP Association site:
http://www.iaresp.it
The Tellus project:
http://tellus.iaresp.it
Research on Radon as seismic precursor:
http://tellus.iaresp.it/il-radon222.html
 Sunshine Coast Australia Live Radiation Monitoring Stations
This is an amateur volunteer run service. The station charts for Caloundra and Golden Beach, are refreshed every 5 minutes. There are two live charts for each monitoring station location. A 120 second logging chart, full width is 2 hours. A 3 hour average chart, full width is 24 hours.
Environmental monitoring station of Carpi (Modena)


This is Luca Ugolini environmental sensor, in the province of Modena. The sensitivity is very high, Thanks to two pipes SBM20.
– – – – – – –
An incredibly radioactive rain
>>> Attention, We took a bath, at the end of this chapter there is an explanation. And the explanation is much less “radioactive” what it seemed. <<<
The day 23 11 2013 Luca station reported an increase of over three times the background radiation. At first we thought it was a disturbance, Why Luke did required inspections and also reset the computer (This is why fragmented chart). But in the end we believe that was just the rain. This is definitely the most radioactive rain that we have seen in recent years. No fear though, keep in mind that in Naples live constantly with radioactivity levels of this kind and no studies have demonstrated a correlation with health problems.

Here is the record of the event from the very words of Luke
First part: This is the situation that has arisen during the night of rain 22/11/2013. The rain began about at 21:00 then she paused and resumed, After a few hours, more intensely.
Second part: Here I restarted the PC to see if it was a defect that occurs due to the software or interface. The doubts have been proven wrong by the graph that continues. Also note that has calmed down the rain and the graph begins to fall.
Third part: In the morning is no tension and I lost hours of the night. At hours 12:00 the sun appeared and the roof has dried completely. The final descent is very significant.
– – – – – – –
Explanation of this event.

Click on the image for a larger view.
The arrow with “1” indicates the “bug”, This time I'm not software bugs but true insects. Evidently the high voltage generates an electrostatic attraction that will stick to the PCB and probably kills them. To avoid doing harm to insects, and even to reliably measure, It is better to use a weatherproof.
Instead the point “2” indicates an oxidized. The condensation that occurs due to extreme changes in temperature can create small water droplets resulting in oxidation, short circuits and abnormal pulse. In all outdoor installations use a watertight container and a desiccant bag.
Do not neglect these signs, We are in the presence of high voltages and high impedance, humidity can cause serious defects and permanent damage.
Environmental monitoring station in Liguria


This is the sensor of Lucignolo, in the province of La Spezia. The mechanical construction is great and thanks to four tubes SBM20, the sensitivity is very high. We finally have a checkpoint in Northwest area, that is particularly sensitive.
The official monitoring network
Currently there is an Italian network of environmental monitoring, the stations are few and their data are not collected in a common map.
Theoretically there should be hundreds of monitoring stations on behalf Harp, Ispra and the like, the only Arpa Piemonte we list a score, as shown in this map.


Data from each sensor Geiger-Mueller, collected every 10 minutes, are sent via radio link with the weather data collected at the same time, the functional Center of Arpa Piemonte in Turin and from here, by computer, are forwarded to Ivrea, Regional Centre ionising and non-ionising radiation… And here they disappear into thin air (Note to Livius)
These stations are paid for with our money and who knows how much they cost. We'd love to see a map on the internet that collects their measures updated every ten minutes, If there is please tell us, We didn't found.
Everything is on the net, are fragmented data in many documents that cover just a few years, and I'm not even CSV file but PDF. PDF files make it difficult to extract data and virtually impossible to process them automatically and present them in a map on the web, that is meaningful and useful to all. And even if someone, with great work, Unable to extract data, the map is always delayed by days or weeks, perpetually waiting for publishing files.
Then the map should make it the harp same, and update it every ten minutes, otherwise what are the expensive radio links? A man reads the data every now and then and who occasionally writes an article on the type: “Rest assured that all is well”
– – – – – – – – –
A good network of environmental monitoring, be taken as an example, is to “ODL Germany – Federal Office for radiation protection”, with approximately 1.800 monitoring stations: http://odlinfo.bfs.de
Or, in the form of interactive map, among the various choices, also allows you to select up to 5 stations and compare the time series: http://www.imis.bfs.de/odlinfo/?lang=EN
And also in the form of video. (by means of gamma rays you see lightning storms and winds that run throughout Germany)
video of 2011 http://vimeo.com/34656566
video of 2012 http://vimeo.com/26157684
Comments
Of course even here are very welcome comments, questions and advice.
Thanks to vs.. program and with some counters Geiger/Mueller in ns. possession we started environmental monitoring, We collaborate scientifically with you for the completion of ns. NET
Would have liked a phone contact so we illustrate our project.
Thank you very much.
Apuan Seismic Observatory
the manager Paul Frediani cell. 3292144399
Thank you for this initiative. Alessio will call ASAP.
Please write here any technical questions or suggestions of common interest, I will answer you promptly.
Regards Livy
I would share my remarks with other.
In my area there’ DSL available by no handler.
There’ any chance for this idea, type send out periodic graphs.
Hello and greetings
Both Latif that for Paul Frediani…
You should look into something like a uniform map of Italy, with boxes for each station. I don't know how to do it, If you can find good solutions we could also do it on the site Theremino. Maybe you can discuss it with you and also with Luciano of DigitalByte that already has three active stations. Probably would do it better than us Luciano.
If you want to call me you can find me at the 0125 57290 from 09 at 20, Hello, Livio
Hi lucignolo ,Dialup Internet definitely….. with a simple modem 56 k.
Otherwise you have to see if WiFi handlers that cover your area.
Hello
Hello luciano
Thanks for the suggestion, I made a contract with a firm that has a ripetittore in my area.
I'm waiting for them to do the job
a resent
Hello
Hello, truly the station remarkable that you did… I had in mind something like that too.. I also have to Spezia, zone 2 June
Andrea asked us via mail:
I would like to find a cheap used tablet and I'll need an http server, Since then the home automation system will poll, to have the data every few. I think this is not a big deal, I have experience with several web servers, and if others are able to publish data on remote servers, should be equal, If not easier, post them on the local server.
I think that in order to assess the correct ventilation of the cellar, It is necessary to keep it fixed. Also living at 1 and 2 floor of a House, I think the real question we can ask level cellar.
It is possible to think you can have a device, analysing the whole range of radiation? Alpha, Beta, range?
Answers
A tablet used may have trouble letting feed from the same drive that connect everything else. (not all tablet stand – possibly insured by the seller that is truly USB OTG + POWER contemporaries!!!) I think in your case instead of a tablet, It would be much better to use a eeeBox or a VAT ACT or a NetBook (maybe used but very carefully that there is Windows and RT)
Then you will need:
– a Master to connect to USB up to ten sensors
https://www.theremino.com/technical/schematics
– a room at ions for radon
https://www.theremino.com/hardware/inputs/radioactivity-sensors
– a geiger tube for Beta Gamma + The geigeradapter
https://www.theremino.com/hardware/inputs/radioactivity-sensors#geigeradapter
– any temperature sensors / Pressure / Moisture / UV
https://www.theremino.com/hardware/inputs/meteorology-sensors
Master + Geiger Tube + Geigeradapter together cost much less than any project for Alpha and Beta that you can find on the net and you have 9 free PIN to connect each sensor type.
Measure the basement
————————————————————————————
You're right to think that the most of the radon is in the cellar. Though, Since in the cellar we pass no time, It is difficult to receive a significant dose of radiation. The environments to be measured are those where you live most of the time. And shave can come, In addition to the ground, even the material of the walls or tiles. For which the tool should be carried for some time, in order to characterize the room where you sleep, the Office, the living room… And you should repeat the steps several times, in each of these environments, in summer and winter, with Windows open and shut, during a thermal inversion, with rain, wind and Sun.
For these reasons, in our opinion, It is always best to have instruments, Let's say not quite as portable phones (because too uncomfortable, missing keyboard and desktop space) but tools that can be moved easily. The ideal is a Notebook, that has everything you need, keyboard included, or a Netbook which costs less.
Alpha sensors, Beta, contemporary range
————————————————————————————
There are geiger tubes, with mica window, that measure also alpha, but are only good for scientific experiments, not for measuring Radon. For Radon the only viable solution is an ion Chamber. It must be large enough to produce results within a reasonable timeframe. The small rooms, with a few cubic centimetres of sensitive area, require weeks of measurement, to give a reliable record. Then you lose the ability to assess variations due to aeration, opening Windows, wind etc..
Sensors of radioactivity to leave stop in one place
————————————————————————————
I can assure you that, When you got an idea of radioactivity in an environment (is Radon that Beta Gamma), no longer makes sense to continue to measure it. Unless major changes (replacement of walls, or of the tiles, or a nuclear explosion within 200 Km) radioactivity does not change, of significant quantities. At most (for radon) could you repeat the steps a few times (in summer and winter). Then, once characterized the environment, It is much better to have portable tool and can control other environments (where you sleep, homes of friends…)
HTTP Server
———————————————————————————
Others have started making HTTP servers and loggers, but no one has posted anything,
I can't tell you a base from which.
Everyone I know, After the first tests have given up, finding more comfortable interacting directly with all system (via Team Viewer), I only see one part via HTTP.
Publish data on local or remote servers is quite similar, You can watch how did we send LOGS and pictures, via FTP, inside ThereminoGeiger. Then, Since the system Theremino is modular, you don't have to modify our software, but only write a small WebServer, fishing data from Slot.
If you do, and you want to share, We will be happy to publish it, for the sake of others thereministi.
Before leaving to write software, I suggest you make friends with the Theremino system.
At a minimum you should connect a Master and turn on an led, with HAL and SlotViewer
It takes some time because Theremino is quite different from similar systems.
https://www.theremino.com/contacts/the-theremino-mission
MI and’ a strange thing with the ion Chamber
And’ always on and some days I hit it by mistake and since then started a count impossible passing by 0,15/0,25 to over 60 PCI/l and staying on these values for three days
I open tip with an air jet and since then started a normal count
And’ success in other? and how come? Which one’ The reason?
Hello and thank you
Of course it's success, It is also explained in the documentation. If particles are present in the room (dust, pieces of plastic, small chips or). And if these particles have the right size. It may happen that are repeatedly enticed by an electrode and the other bouncing very quickly between the two electrodes. Basically you load against the negative electrode and are immediately attracted by the positive. Just touch the positive charge and are attracted to the negative…
If the particles are too small stick to walls. If they are too big the electrostatic force is not enough to make them fly. If you are just the right size bounce fast and the room starts to make a “trrrrrrrrrrr” nearly continuous.
Definitely collide you loose a smear of construction waste plastic. Then blowing it did go out or stuck again somewhere.
Your room has the dust filters?
It has filters and protected by a retina grounded anyway is working fine
Thank you
As I said to Alexis, If you are interested in the subject radioactivity, come and visit us:
http://www.radioactivityforum.it/forum/
and maybe we bring news of the system Theremino
Dario – marconmeteo
Greetings to everyone,after a long time I come to visit you with a question.
I would like to integrate Theremino geiger on domoticz and I would use the TTL-USB adapter + mysql python script.
the question is this ,I can replace the RS232-to-serial GeigerAdapter with a commercial USB Adapter ?(eliminating the transistor)
Thank you
A USB-to-Serial gets a serial port. But then, between the serial and Thermino GeigerAdapter, it takes the adaptation circuit with transistor, three diodes and capacitor. That circuit is used to supply the Geiger Adapter with 5 volts, and also to increase the signal current which otherwise would not be enough to drive the serial.
I hope I have answered right, why did you write “integrare theremino geiger”, I do not know what it is. Perhaps the Theremino-Geiger application? Perhaps the Geiger Adapter with attached a Geiger tube? If I misunderstood the question rifammi, explaining better such thereminici components would like to use.